CVS 2002 Annual Report Download - page 16
Download and view the complete annual report
Please find page 16 of the 2002 CVS annual report below. You can navigate through the pages in the report by either clicking on the pages listed below, or by using the keyword search tool below to find specific information within the annual report.-
 1
1 -
2
-
3
-
4
-
5
-
 6
6 -
 7
7 -
 8
8 -
 9
9 -
 10
10 -
 11
11 -
 12
12 -
 13
13 -
 14
14 -
 15
15 -
 16
16 -
 17
17 -
 18
18 -
 19
19 -
 20
20 -
 21
21 -
 22
22 -
 23
23 -
 24
24 -
 25
25 -
 26
26 -
27
-
28
-
29
-
30
-
31
-
32
-
33
-
34
-
35
-
36
-
37
-
38
-
39
-
40
-
41
-
42
-
43
-
44
 |
 |

14
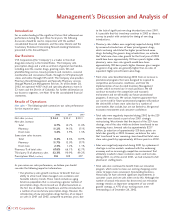
Introduction
For an understanding of the significant factors that influenced our
performance during the past three fiscal years, the following
discussion should be read in conjunction with the audited
consolidated financial statements and the notes thereto and the
Cautionary Statement Concerning Forward-Looking Statements
presented in this Annual Report.
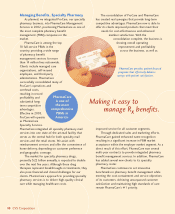
Our Business
CVS Corporation (the “Company”) is a leader in the retail
drugstore industry in the United States. The Company sells
prescription drugs and a wide assortment of general merchandise,
including over-the-counter drugs, greeting cards, film and
photofinishing services, beauty products and cosmetics, seasonal
merchandise and convenience foods, through its CVS/pharmacy®
stores and online through CVS.com®. The Company also provides
Pharmacy Benefit Management and Specialty Pharmacy services
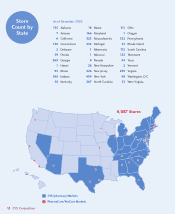
through PharmaCare Management Services. As of December 28,
2002, we operated 4,087 retail and specialty pharmacy stores in
32 states and the District of Columbia. For further information on
our business segments, see Note 10 to the consolidated financial
statements.
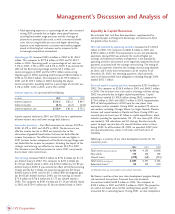
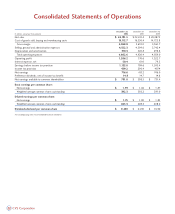
Results of Operations
Net sales ~The following table summarizes our sales performance
for the respective years:
As you review our sales performance, we believe you should
consider the following important information:
•Our pharmacy sales growth continues to benefit from our
ability to attract and retain managed care customers and
favorable industry trends. These trends include an aging
American population that is consuming a greater number of
prescription drugs, the increased use of pharmaceuticals as
the first line of defense for healthcare and the introduction of
a number of successful new prescription drugs. However, the
introduction of new prescription drugs had less of an impact
on sales in 2001 and 2002, compared to previous years, due
to the lack of significant new drug introductions since 2001.
It is possible that this trend may continue in 2003 as there is
no way to predict with certainty the timing of new drug
introductions.
•Pharmacy sales dollars were negatively impacted during 2002
by increased introductions of lower priced generic drugs,
which are being substituted for higher priced brand name
drugs. Excluding the generic drug introductions, we estimate
that total same store sales growth for the fiscal year of 2002
would have been approximately 130 basis points higher, while
pharmacy same store sales growth would have been
approximately 180 basis points higher. However, gross margins
on generic drug sales are generally higher than on sales of
equivalent higher priced brand-name drugs.
•Front store sales benefited during 2002 from an increase in
promotional programs that were designed to respond to
competitive and economic conditions, and from the
implementation of our Assisted Inventory Management
system, which increased our in-stock positions. We will
continue to monitor the competitive and economic
environment and we will modify our future promotional
programs, if necessary. We cannot, however, guarantee that
our current and/or future promotional programs will produce
the desired lift in front store sales due to a number of
uncertainties that include, but are not limited to, the general
economic environment and consumer confidence.
•Total sales were negatively impacted during 2002 by the 229
stores that were closed as part of our 2001 strategic
restructuring. We estimate that the impact of the 229 store
closings, net of the sales which we believe transferred to our
remaining stores, lowered sales by approximately $257
million, (a reduction of approximately 120 basis points on
total sales growth) in 2002. However, we believe the sales
that transferred to our remaining stores benefited total same
store sales growth by approximately 60 basis points in 2002.
•Sales were negatively impacted during 2001 by a pharmacist
shortage in certain markets combined with the weakening
economy and an increasingly competitive environment that
ultimately resulted in lower customer counts and lost sales
during 2001. As of the end of 2001, we had returned to full
pharmacist staffing levels.
•Total sales also continued to benefit from our relocation
program, which seeks to move our existing shopping center
stores to larger, more convenient, freestanding locations.
Historically, we have achieved significant improvements in
customer count and net sales when we do this. Although the
number of annual relocations has decreased, our relocation
strategy remains an important component of our overall
growth strategy, as 47% of our existing stores were
freestanding as of December 28, 2002.
Management’s Discussion and Analysis of
2002 2001 2000
Net sales (in billions) $24.2 $22.2 $20.1
Net sales increase:
Total 8.7% 10.7% 11.0%
Pharmacy 11 . 2 % 14 . 5 % 17. 1 %
Front store 3.8% 3.9% 1.5%
Same store sales increase:
Total 8.4% 8.6% 10.9%
Pharmacy 11 . 7 % 13 . 0 % 17. 7 %
Front store 2.3% 1.2% 1.1%
Pharmacy % of total sales 67.6% 66.1% 62.7%
Third party % of pharmacy sales 92.3% 90.9% 89.2%
Prescriptions filled (in millions) 316 309 297
CVS Corporation