CVS 2002 Annual Report Download - page 17
Download and view the complete annual report
Please find page 17 of the 2002 CVS annual report below. You can navigate through the pages in the report by either clicking on the pages listed below, or by using the keyword search tool below to find specific information within the annual report.-
 1
1 -
2
-
3
-
4
-
5
-
6
-
 7
7 -
 8
8 -
 9
9 -
 10
10 -
 11
11 -
 12
12 -
 13
13 -
 14
14 -
 15
15 -
 16
16 -
 17
17 -
 18
18 -
 19
19 -
 20
20 -
 21
21 -
 22
22 -
 23
23 -
 24
24 -
 25
25 -
 26
26 -
 27
27 -
28
-
29
-
30
-
31
-
32
-
33
-
34
-
35
-
36
-
37
-
38
-
39
-
40
-
41
-
42
-
43
-
44
 |
 |

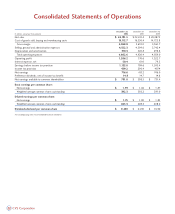
Gross margin, which includes net sales less the cost of
merchandise sold during the reporting period and the related
purchasing costs, warehousing costs, delivery costs and actual and
estimated inventory losses, as a percentage of net sales was 25.1%
in 2002. This compares to 25.6% in 2001 and 26.7% in 2000.
Why has our gross margin rate been declining?
•Pharmacy sales continued to grow at a faster pace than front
store sales. On average, our gross margin on pharmacy sales
is lower than our gross margin on front store sales. Pharmacy
sales as a percentage of total sales for 2002 were 67.6%,
compared to 66.1% in 2001 and 62.7% in 2000.
•Sales to customers covered by third party insurance programs
have continued to increase and, thus, have become a larger
part of our total pharmacy business. On average, our gross
margin on third party pharmacy sales is lower than our gross
margin on cash pharmacy sales. Third party prescription sales
for 2002 were 92.3% of pharmacy sales, compared to
90.9% in 2001 and 89.2% in 2000.
•In recent years, our third party gross margin rates have been
adversely affected by the efforts of managed care
organizations, pharmacy benefit managers, governmental and
other third party payors to reduce prescription drug costs. To
address this trend, we have dropped and/or renegotiated a
number of third party programs that fell below our minimum
profitability standards. These efforts have helped to stabilize
third party reimbursement rates. However, during the latter
part of 2002, as a result of increasing budget shortfalls,
numerous state legislatures proposed or were reported to be
considering reductions in pharmacy reimbursement rates for
Medicaid and other governmental programs as well as other
measures designed to reduce prescription drug costs. In the
event this trend continues and we elect to withdraw from
third party programs and/or decide not to participate in
future programs that fall below our minimum profitability
standards, we may not be able to sustain our current rate of
sales growth and gross margin dollars could be adversely
impacted.
•Also contributing to the gross margin rate decline during
2001 and 2002 were higher markdowns associated with the
increased promotional activity (discussed above) and elevated
physical inventory losses, offset, in part, by the increase in
generic drug sales (also discussed above), which normally
yield a higher gross margin rate than brand name drug sales.
Inventory losses for 2002 were 1.19% of net sales, compared
to 1.52% of net sales in 2001 and 0.60% of net sales in
2000. During 2001, we initiated a number of programs to
address the physical inventory loss trend. These programs
began to reduce inventory losses during the second half of
2002 and we believe they will continue to do so during
2003. However, we cannot guarantee that these programs will
continue to produce the desired results.
Total operating expenses, which include store and administrative
payroll, employee benefits, store and administrative occupancy
costs, selling expenses, advertising expenses, administrative
expenses and depreciation and amortization expense, were 20.1%
of net sales in 2002. This compares to 22.1% of net sales in 2001
and 20.1% in 2000. As you review our performance in this area,
please remember to consider the impact of the following items:
•During 2001, we recorded a $346.8 million pre-tax ($226.9
million after-tax) restructuring and asset impairment charge to
total operating expenses in connection with our 2001
strategic restructuring. We also recorded a $5.7 million pre-
tax ($3.6 million after-tax) charge to cost of goods sold to
reflect the markdown of certain inventory contained in the
closing stores to its net realizable value. In total, the
restructuring and asset impairment charge was $352.5 million
pre-tax ($230.5 million after-tax), the (“Restructuring
Charge”). For further information on the strategic
restructuring and resulting charge, see Note 11 to the
consolidated financial statements.
•During 2001, we received $50.3 million of settlement
proceeds from various lawsuits against certain manufactures
of brand name prescription drugs. We elected to contribute
$46.8 million of the settlement proceeds to the CVS
Charitable Trust, Inc. to fund future charitable giving. The net
effect of these nonrecurring items was a $3.5 million pre-tax
($2.1 million after-tax) increase in net earnings.
•
During 2000, we recorded a $19.2 million pre-tax ($11.5
million after-tax) nonrecurring gain in total operating expenses,
which represented a partial payment from a class action lawsuit
against certain manufacturers of brand name prescription
drugs.
If you exclude the impact of the items discussed above, total
operating expenses as a percentage of net sales were 20.1% in
2002, 20.6% in 2001 and 20.2% in 2000. As you review our
comparable operating expenses, we believe you should consider
the following important information:
•As a result of adopting Statement of Financial Accounting
Standards ("SFAS") No. 142 at the beginning of 2002, we no
longer amortize goodwill. Goodwill amortization totaled
$31.4 million in 2001 and $33.7 million in 2000. For further
information on the impact of adopting SFAS No. 142, see
Note 4 to the consolidated financial statements.
•
Our strong sales performance has consistently allowed net sales
to grow at a faster pace than total operating expenses.
•
Total operating expenses as a percentage of net sales decreased
during 2002 primarily due to the operational initiatives
completed as part of the strategic restructuring and other
technology enhancements (such as the Excellence in Pharmacy
Innovation and Care system), which have lowered operating
costs, particularly at the store level, due to the increased
efficiencies resulting from our more streamlined operating
structure.
Financial Condition and Results of Operation
15
2002 Annual Report