CVS 2002 Annual Report Download - page 18
Download and view the complete annual report
Please find page 18 of the 2002 CVS annual report below. You can navigate through the pages in the report by either clicking on the pages listed below, or by using the keyword search tool below to find specific information within the annual report.-
 1
1 -
2
-
3
-
4
-
5
-
6
-
7
-
 8
8 -
 9
9 -
 10
10 -
 11
11 -
 12
12 -
 13
13 -
 14
14 -
 15
15 -
 16
16 -
 17
17 -
 18
18 -
 19
19 -
 20
20 -
 21
21 -
 22
22 -
 23
23 -
 24
24 -
 25
25 -
 26
26 -
 27
27 -
 28
28 -
29
-
30
-
31
-
32
-
33
-
34
-
35
-
36
-
37
-
38
-
39
-
40
-
41
-
42
-
43
-
44
 |
 |

•
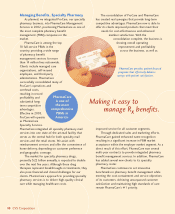
Total operating expenses as a percentage of net sales increased
during 2001 primarily due to higher store payroll expense
resulting from market wage pressures and the shortage of
pharmacists previously discussed, as well as increased benefit
costs due to rising healthcare costs and higher advertising
expense as we implemented a customer reactivation program
aimed at attracting lost customers and in response to the
increasingly competitive environment.
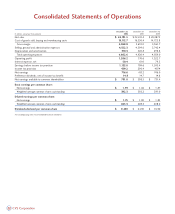
Operating profit increased $435.6 million in 2002 to $1,206.2
million. This compares to $770.6 million in 2001 and $1,322.7
million in 2000. Operating profit as a percentage of net sales was
5.0% in 2002, 3.5% in 2001 and 6.6% in 2000. If you exclude the
effect of the Restructuring Charge and the $3.5 million net
nonrecurring gain in 2001 and the $19.2 million nonrecurring
litigation gain in 2000, operating profit increased $86.6 million in
2002 to $1,206.2 million. This compares to $1,119.6 million in
2001 and $1,303.5 million in 2000. Excluding the above
nonrecurring items, operating profit as a percentage of net sales was
5.0% in 2002, 5.0% in 2001, and 6.5% in 2000.
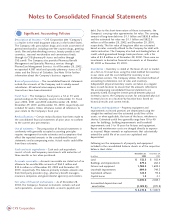
Interest expense, net consisted of the following:
Interest expense declined in 2001 and 2002 due to a combination
of lower interest rates and lower average debt balances.
Income tax provision ~Our effective income tax rate was 38.0% in
2002, 41.8% in 2001 and 40.0% in 2000. The decrease in our
effective income tax rate in 2002 was primarily due to the
elimination of goodwill amortization that was not deductible for
income tax purposes. Our effective income tax rate was higher in
2001 because certain components of the Restructuring Charge were
not deductible for income tax purposes. Excluding the impact of the
strategic restructuring, our effective tax rate was 39.4% in 2001.
The decrease in our effective income tax rate in 2001 was primarily
due to lower state income taxes.
Net earnings increased $303.4 million to $716.6 million (or $1.75
per diluted share) in 2002. This compares to $413.2 million (or
$1.00 per diluted share) in 2001 and $746.0 million (or $1.83 per
diluted share) in 2000. If you exclude the effect of the Restructuring
Charge and the $2.1 million net nonrecurring gain (or $0.56 per
diluted share) in 2001 and the $11.5 million after-tax litigation gain
(or $0.03 per diluted share) in 2000, our net earnings increased
$75.0 million to $716.6 million (or $1.75 per diluted share) in
2002. This compares to $641.6 million (or $1.56 per diluted share)
in 2001 and $734.5 million (or $1.80 per diluted share) in 2000.
Liquidity & Capital Resources
We anticipate that cash flow from operations, supplemented by
commercial paper and long-term borrowings, will continue to fund
the growth of our business.
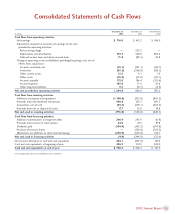
Net cash provided by operating activities increased to $1,204.8
million in 2002. This compares to $680.6 million in 2001 and
$780.2 million in 2000. The improvement in net cash provided by
operations during 2002 was primarily the result of higher net
earnings and improved inventory management. Cash provided by
operating activities will continue to be negatively impacted by future
payments associated with the strategic restructuring. The timing of
future cash payments related to the strategic restructuring depends
on when, and if, early lease terminations can be reached. As of
December 28, 2002, the remaining payments, which primarily
consist of noncancelable lease obligations extending through 2024,
totaled $192.1 million.
Net cash used in investing activities increased to $735.8 million in
2002. This compares to $536.8 million in 2001 and $640.5 million
in 2000. The increase in net cash used in investing activities during
2002 was primarily due to higher capital expenditures. Capital
expenditures totaled $1,108.8 million during 2002, compared to
$713.6 million in 2001 and $695.3 million in 2000. Approximately
89% of total expenditures in 2002 were for new stores, store
expansions and/or remodels. During 2002, we opened 78 stores in
new markets, including: Chicago, Illinois; Las Vegas, Nevada; Phoenix,
Arizona; and several markets in Florida and Texas. During 2003, we
currently plan to invest over $1 billion in capital expenditures, which
includes spending for approximately 150 -175 new stores (80-100 in
new markets), 100 relocations and 50 closings. We also currently
expect to begin construction of a new distribution center in Texas
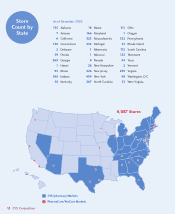
during 2003. As of December 28, 2002, we operated 4,087 retail
and specialty pharmacy stores in 32 states and the District of
Columbia.
Following is a summary of our store development activity for the
respective years:
We finance a portion of our new store development program through
sale-leaseback transactions. Proceeds from sale-leaseback
transactions totaled $448.8 million in 2002. This compares to
$323.3 million in 2001 and $299.3 million in 2000. The properties
are sold at net book value and the resulting leases qualify and are
accounted for as operating leases. During 2001, we also completed a
Management’s Discussion and Analysis of
16 CVS Corporation
In millions 2002 2001 2000
Interest expense $54.5 $65.2 $84.1
Interest income (4.1) (4.2) (4.8)
Interest expense, net $50.4 $61.0 $79.3
2002 2001 2000
Total stores (beginning of year) 4,191 4,133 4,098
New stores 174 126 158
Closed stores (278) (68) (123)
Total stores (end of year) 4,087 4,191 4,133
Relocated stores(1) 92 122 23 0
(1) Relocated stores are not included in new or closed store totals.