American Airlines 2001 Annual Report Download - page 17
Download and view the complete annual report
Please find page 17 of the 2001 American Airlines annual report below. You can navigate through the pages in the report by either clicking on the pages listed below, or by using the keyword search tool below to find specific information within the annual report.-
 1
1 -
2
-
3
-
4
-
5
-
6
-
 7
7 -
 8
8 -
 9
9 -
 10
10 -
 11
11 -
 12
12 -
 13
13 -
 14
14 -
 15
15 -
 16
16 -
 17
17 -
 18
18 -
 19
19 -
 20
20 -
 21
21 -
 22
22 -
 23
23 -
 24
24 -
 25
25 -
 26
26 -
 27
27 -
28
-
29
-
30
-
31
-
32
-
33
-
34
-
35
-
36
-
37
-
38
-
39
-
40
-
41
-
42
-
43
-
44
-
45
-
46
-
47
-
48
 |
 |

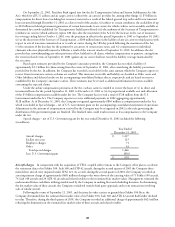
15
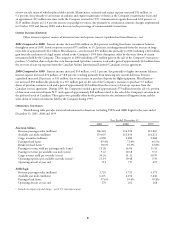
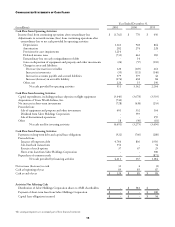
CONSOLIDATED STATEMENTS OF CASH FLOWS
Year Ended December 31,
(in millions) 2001 2000 1999
Cash Flow from Operating Activities:
Income (loss) from continuing operations after extraordinary loss $ (1,762) $ 770 $ 656
Adjustments to reconcile income (loss) from continuing operations after
extraordinary loss to net cash provided by operating activities:
Depreciation 1,122 928 864
Amortization 282 274 228
Provisions for asset impairments 1,214 - -
Deferred income taxes (731) 461 183
Extraordinary loss on early extinguishment of debt - 14 -
Gain on disposition of equipment and property and other investments (24) (57) (110)
Change in assets and liabilities:
Decrease (increase) in receivables 120 (169) 261
Increase in inventories (39) (111) (140)
Increase in accounts payable and accrued liabilities 379 579 42
Increase (decrease) in air traffic liability (276) 438 84
Other, net 226 15 196
Net cash provided by operating activities 511 3,142 2,264
Cash Flow from Investing Activities:
Capital expenditures, including purchase deposits on flight equipment (3,640) (3,678) (3,539)
Acquisition of Trans World Airlines, Inc. (742) - -
Net increase in short-term investments (728) (438) (253)
Proceeds from:
Sale of equipment and property and other investments 401 332 164
Dividend from Sabre Holdings Corporation - 559 -
Sale of discontinued operations - - 259
Other 18 (50) (81)
Net cash used for investing activities (4,691) (3,275) (3,450)
Cash Flow from Financing Activities:
Payments on long-term debt and capital lease obligations (922) (766) (280)
Proceeds from:
Issuance of long-term debt 4,744 836 1,956
Sale-leaseback transactions 352 - 54
Exercise of stock options 37 67 25
Short-term loan from Sabre Holdings Corporation - - 300
Repurchase of common stock - - (871)
Net cash provided by financing activities 4,211 137 1,184
Net increase (decrease) in cash 31 4 (2)
Cash at beginning of year 89 85 87
Cash at end of year $ 120 $ 89 $ 85
Activities Not Affecting Cash
Distribution of Sabre Holdings Corporation shares to AMR shareholders $ - $ 581 $ -
Payment of short-term loan from Sabre Holdings Corporation $ - $ - $ 300
Capital lease obligations incurred $ - $ - $ 54
The accompanying notes are an integral part of these financial statements.