American Airlines 2001 Annual Report Download - page 10
Download and view the complete annual report
Please find page 10 of the 2001 American Airlines annual report below. You can navigate through the pages in the report by either clicking on the pages listed below, or by using the keyword search tool below to find specific information within the annual report.-
 1
1 -
 2
2 -
 3
3 -
 4
4 -
 5
5 -
 6
6 -
 7
7 -
 8
8 -
 9
9 -
 10
10 -
 11
11 -
 12
12 -
 13
13 -
 14
14 -
 15
15 -
 16
16 -
 17
17 -
 18
18 -
 19
19 -
 20
20 -
 21
21 -
22
-
23
-
24
-
25
-
26
-
27
-
28
-
29
-
30
-
31
-
32
-
33
-
34
-
35
-
36
-
37
-
38
-
39
-
40
-
41
-
42
-
43
-
44
-
45
-
46
-
47
-
48
 |
 |

8
of new aircraft, many of which replaced older aircraft. Maintenance, materials and repairs expense increased $92 million, or
9.2 percent, due primarily to an increase in airframe and engine maintenance volumes at the Company’s maintenance bases and
an approximate $17 million one-time credit the Company received in 1999. Commissions to agents decreased 10.8 percent, or
$125 million, despite an 11.4 percent increase in passenger revenues, due primarily to commission structure changes implemented
in October 1999 and January 2000, and a decrease in the percentage of commissionable transactions.
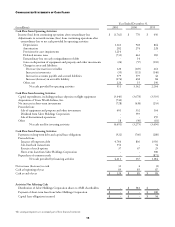
OTHER INCOME (EXPENSE)
Other income (expense) consists of interest income and expense, interest capitalized and miscellaneous – net.
2001 Compared to 2000 Interest income decreased $44 million, or 28.6 percent, resulting from lower investment balances
throughout most of 2001. Interest expense increased $71 million, or 15.2 percent, resulting primarily from the increase in long-
term debt of approximately $4.2 billion. Miscellaneous – net decreased $70 million due primarily to 2001 including a $45 million
gain from the settlement of a legal matter related to the Company’s 1999 labor disruption, offset by the write-down of certain
investments held by the Company. This compares to 2000 including a $57 million gain on the sale of the Company’s warrants to
purchase 5.5 million shares of priceline.com Incorporated (priceline) common stock and a gain of approximately $41 million from
the recovery of start-up expenses from the Canadian Airlines International Limited (Canadian) services agreement.
2000 Compared to 1999 Interest income increased $59 million, or 62.1 percent, due primarily to higher investment balances.
Interest expense increased $74 million, or 18.8 percent, resulting primarily from financing new aircraft deliveries. Interest
capitalized increased 28 percent, or $33 million, due to an increase in purchase deposits for flight equipment. Miscellaneous –
net increased $38 million due primarily to a $57 million gain on the sale of the Company’s warrants to purchase 5.5 million
shares of priceline common stock and a gain of approximately $41 million from the recovery of start-up expenses from the
Canadian services agreement. During 1999, the Company recorded a gain of approximately $75 million from the sale of a portion
of American’s interest in Equant N.V. and a gain of approximately $40 million related to the sale of the Company’s investment in
the preferred stock of Canadian. These gains were partially offset by the provision for the settlement of litigation items and the
write-down of certain investments held by the Company during 1999.
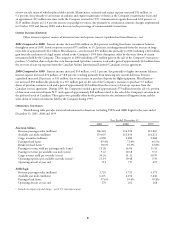
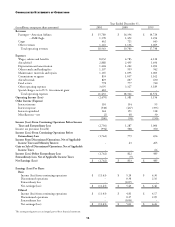
OPERATING STATISTICS
The following table provides statistical information for American (excluding TWA) and AMR Eagle for the years ended
December 31, 2001, 2000 and 1999.
Year Ended December 31,
2001 2000 1999
American Airlines
Revenue passenger miles (millions) 106,224 116,594 112,067
Available seat miles (millions) 153,035 161,030 161,211
Cargo ton miles (millions) 2,058 2,280 2,068
Passenger load factor 69.4% 72.4% 69.5%
Breakeven load factor * 78.1% 65.9% 63.8%
Passenger revenue yield per passenger mile (cents) 13.28 14.06 13.14
Passenger revenue per available seat mile (cents) 9.22 10.18 9.13
Cargo revenue yield per ton mile (cents) 30.24 31.31 30.70
Operating expenses per available seat mile (cents) * 11.14 10.48 9.50
Operating aircraft at year end 712 717 697
AMR Eagle
Revenue passenger miles (millions) 3,725 3,731 3,371
Available seat miles (millions) 6,471 6,256 5,640
Passenger load factor 57.6% 59.6% 59.8%
Operating aircraft at year end 276 261 268
* Excludes the impact of special charges – net of U.S. Government grant