Advance Auto Parts 2010 Annual Report Download - page 95
Download and view the complete annual report
Please find page 95 of the 2010 Advance Auto Parts annual report below. You can navigate through the pages in the report by either clicking on the pages listed below, or by using the keyword search tool below to find specific information within the annual report.-
 1
1 -
2
-
3
-
4
-
5
-
6
-
7
-
8
-
9
-
10
-
11
-
12
-
13
-
14
-
15
-
16
-
17
-
18
-
19
-
20
-
21
-
22
-
23
-
24
-
25
-
26
-
27
-
28
-
29
-
30
-
31
-
32
-
33
-
34
-
35
-
36
-
37
-
38
-
39
-
40
-
41
-
42
-
43
-
44
-
45
-
46
-
47
-
48
-
49
-
50
-
51
-
52
-
53
-
54
-
55
-
56
-
57
-
58
-
59
-
60
-
61
-
62
-
63
-
64
-
65
-
66
-
67
-
68
-
69
-
70
-
71
-
72
-
73
-
74
-
75
-
76
-
77
-
78
-
79
-
80
-
81
-
82
-
83
-
84
-
 85
85 -
 86
86 -
 87
87 -
 88
88 -
 89
89 -
 90
90 -
 91
91 -
 92
92 -
 93
93 -
 94
94 -
 95
95 -
 96
96 -
 97
97 -
 98
98 -
 99
99 -
 100
100 -
 101
101 -
 102
102 -
 103
103 -
 104
104 -
 105
105 -
106
-
107
-
108
-
109
-
110
-
111
-
112
 |
 |

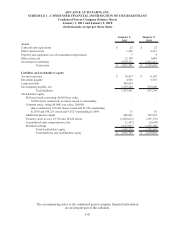
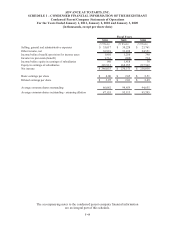
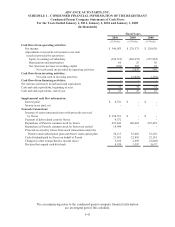
ADVANCE AUTO PARTS, INC. AND SUBSIDIARIES
NOTES TO THE CONSOLIDATED FINANCIAL STATEMENTS
January 1, 2011, January 2, 2010 and January 3, 2009
(in thousands, except per share data)
.
F-41
22. Quarterly Financial Data (unaudited):
The following table summarizes quarterly financial data for Fiscal 2010 and 2009:
2010 First Second Third Fourth
(16 weeks) (12 weeks) (12 weeks) (12 weeks)
Net sales 1,830,606$ 1,417,956$ 1,406,511$ 1,270,130$
Gross profit 910,777 715,268 707,785 627,485
Net income 109,431 100,911 87,598 48,113
Basic earnings per share 1.20 1.18 1.04 0.58
Diluted earnings per share 1.19 1.16 1.03 0.57
2009 First Second Third Fourth
(16 weeks) (12 weeks) (12 weeks) (12 weeks)
Net sales 1,683,636$ 1,322,844$ 1,262,576$ 1,143,567$
Gross profit 821,988 652,650 621,459 548,129
Net income 93,585 80,330 61,979 34,479
Basic earnings per share 0.99 0.84 0.65 0.37
Diluted earnings per share 0.98 0.83 0.65 0.36
Note: Quarterly and year-to-date computations of per share amounts are made independently. Therefore, the
sum of per share amounts for the quarters may not round to per share amounts for the year.