Advance Auto Parts 2010 Annual Report Download - page 94
Download and view the complete annual report
Please find page 94 of the 2010 Advance Auto Parts annual report below. You can navigate through the pages in the report by either clicking on the pages listed below, or by using the keyword search tool below to find specific information within the annual report.-
 1
1 -
2
-
3
-
4
-
5
-
6
-
7
-
8
-
9
-
10
-
11
-
12
-
13
-
14
-
15
-
16
-
17
-
18
-
19
-
20
-
21
-
22
-
23
-
24
-
25
-
26
-
27
-
28
-
29
-
30
-
31
-
32
-
33
-
34
-
35
-
36
-
37
-
38
-
39
-
40
-
41
-
42
-
43
-
44
-
45
-
46
-
47
-
48
-
49
-
50
-
51
-
52
-
53
-
54
-
55
-
56
-
57
-
58
-
59
-
60
-
61
-
62
-
63
-
64
-
65
-
66
-
67
-
68
-
69
-
70
-
71
-
72
-
73
-
74
-
75
-
76
-
77
-
78
-
79
-
80
-
81
-
82
-
83
-
 84
84 -
 85
85 -
 86
86 -
 87
87 -
 88
88 -
 89
89 -
 90
90 -
 91
91 -
 92
92 -
 93
93 -
 94
94 -
 95
95 -
 96
96 -
 97
97 -
 98
98 -
 99
99 -
 100
100 -
 101
101 -
 102
102 -
 103
103 -
 104
104 -
105
-
106
-
107
-
108
-
109
-
110
-
111
-
112
 |
 |

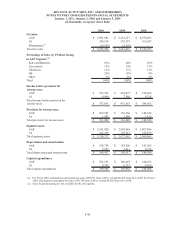
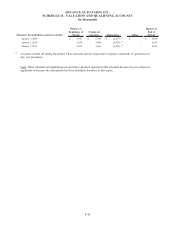
ADVANCE AUTO PARTS, INC. AND SUBSIDIARIES
NOTES TO THE CONSOLIDATED FINANCIAL STATEMENTS
January 1, 2011, January 2, 2010 and January 3, 2009
(in thousands, except per share data)
.
F-40
2010 2009 2008
Net Sales
AAP 5,691,081$ 5,218,317$ 4,976,603$
AI 249,514 202,575 165,652
Eliminations (1) (15,392) (8,269) -
Total net sales 5,925,203$ 5,412,623$ 5,142,255$
Percentage of Sales, by Product Group
in AAP Segment (2)
Parts and Batteries 61% 60% 58%
Accessories 15% 15% 17%
Chemicals 11% 11% 12%
Oil 10% 10% 9%
Other 3% 4% 4%
Total 100% 100% 100%
Income before provision for
income taxes
AAP 552,565$ 424,075$ 376,464$
AI 4,490 7,580 4,228
Total income before provision for
income taxes 557,055$ 431,655$ 380,692$
Provision for income taxes
AAP 209,545$ 158,386$ 140,838$
AI 1,457 2,896 1,816
Total provision for income taxes 211,002$ 161,282$ 142,654$
Segment assets
AAP 3,141,828$ 2,902,646$ 2,807,486$
AI 212,389 170,317 156,579
Total segment assets 3,354,217$ 3,072,963$ 2,964,065$
Depreciation and amortization
AAP 158,738$ 145,506$ 141,202$
AI 5,699 5,411 5,378
Total depreciation and amortizatio
n
164,437$ 150,917$ 146,580$
Capital expenditures
AAP 191,193$ 186,607$ 180,623$
AI 8,392 6,327 4,363
Total capital expenditures 199,585$ 192,934$ 184,986$
(1) For Fiscal 2010, eliminations represented net sales of $6,933 from AAP to AI and $8,459 from AI to AAP. For Fiscal
2009, eliminations represented net sales of $3,764 from AAP to AI and $4,505 from AI to AAP.
(2) Sales by product group are not available for the AI segment.