Advance Auto Parts 2010 Annual Report Download - page 80
Download and view the complete annual report
Please find page 80 of the 2010 Advance Auto Parts annual report below. You can navigate through the pages in the report by either clicking on the pages listed below, or by using the keyword search tool below to find specific information within the annual report.-
 1
1 -
2
-
3
-
4
-
5
-
6
-
7
-
8
-
9
-
10
-
11
-
12
-
13
-
14
-
15
-
16
-
17
-
18
-
19
-
20
-
21
-
22
-
23
-
24
-
25
-
26
-
27
-
28
-
29
-
30
-
31
-
32
-
33
-
34
-
35
-
36
-
37
-
38
-
39
-
40
-
41
-
42
-
43
-
44
-
45
-
46
-
47
-
48
-
49
-
50
-
51
-
52
-
53
-
54
-
55
-
56
-
57
-
58
-
59
-
60
-
61
-
62
-
63
-
64
-
65
-
66
-
67
-
68
-
69
-
 70
70 -
 71
71 -
 72
72 -
 73
73 -
 74
74 -
 75
75 -
 76
76 -
 77
77 -
 78
78 -
 79
79 -
 80
80 -
 81
81 -
 82
82 -
 83
83 -
 84
84 -
 85
85 -
 86
86 -
 87
87 -
 88
88 -
 89
89 -
 90
90 -
91
-
92
-
93
-
94
-
95
-
96
-
97
-
98
-
99
-
100
-
101
-
102
-
103
-
104
-
105
-
106
-
107
-
108
-
109
-
110
-
111
-
112
 |
 |

ADVANCE AUTO PARTS, INC. AND SUBSIDIARIES
NOTES TO THE CONSOLIDATED FINANCIAL STATEMENTS
January 1, 2011, January 2, 2010 and January 3, 2009
(in thousands, except per share data)
.
F-26
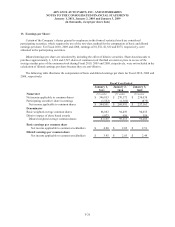
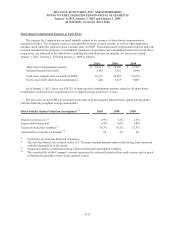
13. Earnings per Share:
Certain of the Company’s shares granted to employees in the form of restricted stock are considered
participating securities, which requires the use of the two-class method for the computation of basic and diluted
earnings per share. For Fiscal 2010, 2009 and 2008, earnings of $1,552, $1,382 and $875, respectively, were
allocated to the participating securities.
Diluted earnings per share are calculated by including the effect of dilutive securities. Share-based awards to
purchase approximately 3, 1,224 and 2,747 shares of common stock that had an exercise price in excess of the
average market price of the common stock during Fiscal 2010, 2009 and 2008, respectively, were not included in the
calculation of diluted earnings per share because they are anti-dilutive.
The following table illustrates the computation of basic and diluted earnings per share for Fiscal 2010, 2009 and
2008, respectively:
January 1, January 2, January 3,
2011 2010 2009
Numerator (52 weeks) (52 weeks) (53 weeks)
Net income applicable to common shares 346,053$ 270,373$ 238,038$
Participating securities' share in earnings (1,552) (1,382) (875)
Net income applicable to common shares 344,501$ 268,991$ 237,163$
Denominator
Basic weighted average common shares 86,082 94,459 94,655
Dilutive impact of share based awards 1,073 654 550
Diluted weighted average common shares 87,155 95,113 95,205
Basic earnings per common share
Net income applicable to common stockholders 4.00$ 2.85$ 2.51$
Diluted earnings per common share
Net income applicable to common stockholders 3.95$ 2.83$ 2.49$
Fiscal Year Ended