Advance Auto Parts 2010 Annual Report Download - page 38
Download and view the complete annual report
Please find page 38 of the 2010 Advance Auto Parts annual report below. You can navigate through the pages in the report by either clicking on the pages listed below, or by using the keyword search tool below to find specific information within the annual report.-
 1
1 -
2
-
3
-
4
-
5
-
6
-
7
-
8
-
9
-
10
-
11
-
12
-
13
-
14
-
15
-
16
-
17
-
18
-
19
-
20
-
21
-
22
-
23
-
24
-
25
-
26
-
27
-
 28
28 -
 29
29 -
 30
30 -
 31
31 -
 32
32 -
 33
33 -
 34
34 -
 35
35 -
 36
36 -
 37
37 -
 38
38 -
 39
39 -
 40
40 -
 41
41 -
 42
42 -
 43
43 -
 44
44 -
 45
45 -
 46
46 -
 47
47 -
 48
48 -
49
-
50
-
51
-
52
-
53
-
54
-
55
-
56
-
57
-
58
-
59
-
60
-
61
-
62
-
63
-
64
-
65
-
66
-
67
-
68
-
69
-
70
-
71
-
72
-
73
-
74
-
75
-
76
-
77
-
78
-
79
-
80
-
81
-
82
-
83
-
84
-
85
-
86
-
87
-
88
-
89
-
90
-
91
-
92
-
93
-
94
-
95
-
96
-
97
-
98
-
99
-
100
-
101
-
102
-
103
-
104
-
105
-
106
-
107
-
108
-
109
-
110
-
111
-
112
 |
 |

23
sales. We believe that our focus on differentiating through our strategies of Service Leadership and Superior
Availability will allow us to continue to increase our share of the total automotive aftermarket with a higher growth
potential driven by the more fragmented Commercial market.
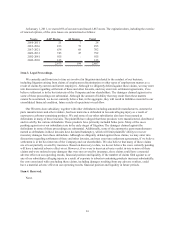
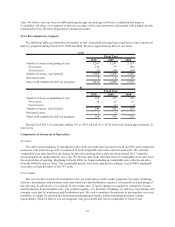
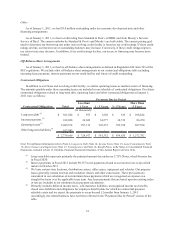
Store Development by Segment
The following table sets forth the total number of new, closed and relocated stores and stores with Commercial
delivery programs during Fiscal 2010, 2009 and 2008. We lease approximately 80% of our stores.
2010 2009 2008
Number of stores at beginning of year 3,264 3,243 3,153
New stores 110 75 109
Closed stores (5) (54) (19)
Number of stores, end of period 3,369 3,264 3,243
Relocated stores 9 6 10
Stores with commercial delivery programs 3,018 2,868 2,755
2010 2009 2008
Number of stores at beginning of year 156 125 108
New stores 38 32 18
Closed stores - (1) (1)
Number of stores, end of period 194 156 125
Relocated stores 3 4 -
Stores with commercial delivery programs 194 156 125
AAP
Fiscal Year
AI
Fiscal Year
During Fiscal 2011, we anticipate adding 110 to 120 AAP and 10 to 20 AI stores and closing approximately 10
total stores.
Components of Statement of Operations
Net Sales
Net sales consist primarily of merchandise sales from our retail store locations to both our DIY and Commercial
customers. Our total sales growth is comprised of both comparable store sales and new store sales. We calculate
comparable store sales based on the change in store sales starting once a store has been opened for 13 complete
accounting periods (approximately one year). We include sales from relocated stores in comparable store sales from
the original date of opening. Beginning in Fiscal 2008, we began including in comparable store sales the net sales
from the Offshore and AI stores. The comparable periods have been adjusted accordingly. Fiscal 2008 comparable
store sales exclude the effect of the 53rd week.
Cost of Sales
Our cost of sales consists of merchandise costs, net of incentives under vendor programs; inventory shrinkage,
defective merchandise and warranty costs; and warehouse and distribution expenses. Gross profit as a percentage of
net sales may be affected by (i) variations in our product mix, (ii) price changes in response to competitive factors
and fluctuations in merchandise costs, (iii) vendor programs, (iv) inventory shrinkage, (v) defective merchandise and
warranty costs and (v) warehouse and distribution costs. We seek to minimize fluctuations in merchandise costs and
instability of supply by entering into long-term purchasing agreements, without minimum purchase volume
requirements, when we believe it is advantageous. Our gross profit may not be comparable to those of our