Advance Auto Parts 2010 Annual Report Download - page 40
Download and view the complete annual report
Please find page 40 of the 2010 Advance Auto Parts annual report below. You can navigate through the pages in the report by either clicking on the pages listed below, or by using the keyword search tool below to find specific information within the annual report.-
 1
1 -
2
-
3
-
4
-
5
-
6
-
7
-
8
-
9
-
10
-
11
-
12
-
13
-
14
-
15
-
16
-
17
-
18
-
19
-
20
-
21
-
22
-
23
-
24
-
25
-
26
-
27
-
28
-
29
-
 30
30 -
 31
31 -
 32
32 -
 33
33 -
 34
34 -
 35
35 -
 36
36 -
 37
37 -
 38
38 -
 39
39 -
 40
40 -
 41
41 -
 42
42 -
 43
43 -
 44
44 -
 45
45 -
 46
46 -
 47
47 -
 48
48 -
 49
49 -
 50
50 -
51
-
52
-
53
-
54
-
55
-
56
-
57
-
58
-
59
-
60
-
61
-
62
-
63
-
64
-
65
-
66
-
67
-
68
-
69
-
70
-
71
-
72
-
73
-
74
-
75
-
76
-
77
-
78
-
79
-
80
-
81
-
82
-
83
-
84
-
85
-
86
-
87
-
88
-
89
-
90
-
91
-
92
-
93
-
94
-
95
-
96
-
97
-
98
-
99
-
100
-
101
-
102
-
103
-
104
-
105
-
106
-
107
-
108
-
109
-
110
-
111
-
112
 |
 |

25
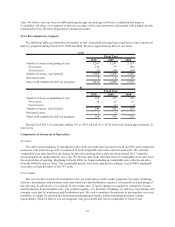
sourcing are beginning to drive improvements in our gross profit on accessories.
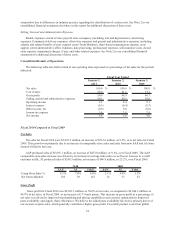
SG&A Expenses
SG&A expenses for Fiscal 2010 were $2,376.4 million, or 40.1% of net sales, as compared to $2,189.8 million,
or 40.5% of net sales, for Fiscal 2009, representing a decrease of 35 basis points. This overall decrease in SG&A
expenses was primarily due to the absence of store divestiture costs in Fiscal 2010, leverage in occupancy and other
fixed costs driven by our 8.0% comparable store sales increase in Fiscal 2010 and a planned decrease in incremental
spending on our strategic capabilities, partially offset by increased incentive compensation and advertising.
Operating Income
Operating income for Fiscal 2010 was $584.9 million, representing 9.9% of net sales, as compared to $454.4
million, or 8.4% of net sales, for Fiscal 2009, or an increase of 148 basis points. This increase in operating income,
as a percentage of net sales, reflects a significant increase in sales and gross profit rate combined with a slightly
lower SG&A expense rate.
AAP produced operating income of $580.4 million, or 10.2% of net sales, for Fiscal 2010 as compared to
$446.8 million, or 8.6% of net sales, for Fiscal 2009. AI generated operating income for Fiscal 2010 of $4.5 million
as compared to $7.6 million for Fiscal 2009. AI’s operating income decreased during Fiscal 2010 primarily due to a
lower gross profit rate as well as higher SG&A expenses associated with the acceleration of new store openings.
Interest Expense
Interest expense for Fiscal 2010 was $26.9 million, or 0.5% of net sales, as compared to $23.3 million, or 0.4%
of net sales, in Fiscal 2009. The increase in interest expense as a percentage of sales is primarily a result of the
amortization of previously recorded unrecognized losses in accumulated other comprehensive loss over the
remaining life of interest rate swaps. The swaps are associated with bank debt which we repaid near the beginning of
the second quarter.
Income Taxes
Income tax expense for Fiscal 2010 was $211.0 million, as compared to $161.3 million for Fiscal 2009. Our
effective income tax rate was 37.9% and 37.4% for Fiscal 2010 and Fiscal 2009, respectively.
Net Income
Net income was $346.1 million, or $3.95 per diluted share, for Fiscal 2010 as compared to $270.4 million, or
$2.83 per diluted share, for Fiscal 2009. As a percentage of net sales, net income for Fiscal 2010 was 5.8%, as
compared to 5.0% for Fiscal 2009. The increase in diluted earnings per share was primarily due to growth in our
operating income and the decrease in our average share count as a result of our repurchase of 13.0 million shares of
our common stock over the last year.
Fiscal 2009 Compared to Fiscal 2008
Net Sales
Net sales for Fiscal 2009 were $5,412.6 million, an increase of $270.4 million, or 5.3%, over net sales for Fiscal
2008. Excluding the $88.8 million impact of the 53rd week in Fiscal 2008, our sales increase was 7.1%. This growth
was primarily due to an increase in comparable store sales of 5.3% and sales from the net addition of 52 new AAP
and AI stores opened within the last year.
AAP produced sales of $5,218.3 million, an increase of $241.7 million, or 4.9%, over Fiscal 2008. Excluding
the $86.5 million impact of the 53rd week in Fiscal 2008, AAP’s sales increase was 6.7%. This growth was primarily
due to a 5.1% comparable store sales increase and sales from the net addition of 21 new stores opened within the last
year. The AAP comparable store sales increase was driven by an increase in average ticket sales and overall