Advance Auto Parts 2010 Annual Report Download - page 35
Download and view the complete annual report
Please find page 35 of the 2010 Advance Auto Parts annual report below. You can navigate through the pages in the report by either clicking on the pages listed below, or by using the keyword search tool below to find specific information within the annual report.-
 1
1 -
2
-
3
-
4
-
5
-
6
-
7
-
8
-
9
-
10
-
11
-
12
-
13
-
14
-
15
-
16
-
17
-
18
-
19
-
20
-
21
-
22
-
23
-
24
-
 25
25 -
 26
26 -
 27
27 -
 28
28 -
 29
29 -
 30
30 -
 31
31 -
 32
32 -
 33
33 -
 34
34 -
 35
35 -
 36
36 -
 37
37 -
 38
38 -
 39
39 -
 40
40 -
 41
41 -
 42
42 -
 43
43 -
 44
44 -
 45
45 -
46
-
47
-
48
-
49
-
50
-
51
-
52
-
53
-
54
-
55
-
56
-
57
-
58
-
59
-
60
-
61
-
62
-
63
-
64
-
65
-
66
-
67
-
68
-
69
-
70
-
71
-
72
-
73
-
74
-
75
-
76
-
77
-
78
-
79
-
80
-
81
-
82
-
83
-
84
-
85
-
86
-
87
-
88
-
89
-
90
-
91
-
92
-
93
-
94
-
95
-
96
-
97
-
98
-
99
-
100
-
101
-
102
-
103
-
104
-
105
-
106
-
107
-
108
-
109
-
110
-
111
-
112
 |
 |
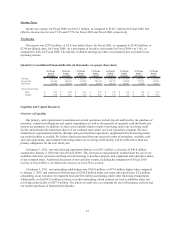
20
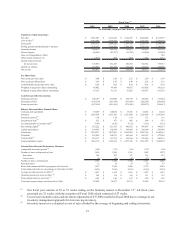
(4) Inventory per store is calculated as ending inventory divided by ending store count.
(5) Accounts payable to inventory ratio is calculated as ending accounts payable divided by ending inventory. We
aggregate financed vendor accounts payable with accounts payable to calculate our accounts payable to inventory
ratio.
(6) Net working capital is calculated by subtracting current liabilities from current assets.
(7) Net debt includes total debt and bank overdrafts, less cash and cash equivalents.
(8) Comparable store sales growth is calculated based on the change in net sales starting once a store has been
open for 13 complete accounting periods (each period represents four weeks). Relocations are included in
comparable store sales growth from the original date of opening. Beginning in Fiscal 2008, we include in
comparable store sales growth the net sales from stores operated Offshore and AI stores. The comparable
periods have been adjusted accordingly. Fiscal 2008 comparable store sales growth excludes sales from the
53rd week.
(9) Average net sales per store is calculated as net sales divided by the average of the beginning and the ending
number of stores for the respective period. Excluding the net sales impact of the 53rd week of Fiscal 2008 of
approximately $88,800, average net sales per store in Fiscal 2008 was $1,524.
(10) Operating income per store is calculated as operating income divided by the average of beginning and ending
total store count for the respective period. Operating income per store for Fiscal 2009 was $142 excluding the
$26,100 impact of store divestitures. Excluding the operating income impact of the 53rd week of Fiscal 2008 of
approximately $15,800 and a $37,500 non-cash inventory adjustment, operating income per store in Fiscal
2008 was $132.
(11) Gross margin return on inventory is calculated as gross profit divided by an average of beginning and ending
inventory, net of accounts payable and financed vendor accounts payable. Excluding the gross profit impact of the
53rd week of Fiscal 2008 of approximately $44,000 and a $37,500 non-cash inventory adjustment, gross margin
return on inventory in Fiscal 2008 was $3.37.
Item 7. Management's Discussion and Analysis of Financial Condition and Results of Operations.
The following discussion and analysis of financial condition and results of operations should be read in
conjunction with "Selected Consolidated Financial Data," our consolidated historical financial statements and the
notes to those statements that appear elsewhere in this report. Our discussion contains forward-looking statements
based upon current expectations that involve risks and uncertainties, such as our plans, objectives, expectations and
intentions. Actual results and the timing of events could differ materially from those anticipated in these forward-
looking statements as a result of a number of factors, including those set forth under the sections entitled “Forward-
Looking Statements” and "Risk Factors" elsewhere in this report.
Our fiscal year ends on the Saturday nearest December 31st of each year, which results in an extra week every
several years (Fiscal 2008 contained 53 weeks). Our first quarter consists of 16 weeks, and the other three quarters
consist of 12 weeks, with the exception of the fourth quarter of Fiscal 2008 which contained 13 weeks due to our 53-
week Fiscal 2008.
Introduction
We are a leading specialty retailer of automotive aftermarket parts, accessories, batteries and maintenance items
primarily operating within the United States. Our stores carry an extensive product line for cars, vans, sport utility
vehicles and light trucks. We serve both DIY and Commercial customers. At January 1, 2011, we operated 3,563
stores throughout 39 states, Puerto Rico and the Virgin Islands.
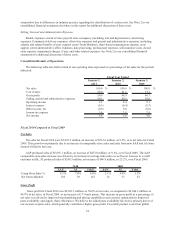
We operate in two reportable segments: Advance Auto Parts, or AAP, and Autopart International Inc., or AI.
The AAP segment is comprised of our store operations within the United States, Puerto Rico and the Virgin Islands
which operate under the trade names “Advance Auto Parts,” “Advance Discount Auto Parts” and “Western Auto.”
At January 1, 2011, we operated 3,369 stores in the AAP segment, of which 3,343 stores operated under the trade
names “Advance Auto Parts” and “Advance Discount Auto Parts” throughout 39 states in the Northeastern,
Southeastern and Midwestern regions of the United States. These stores offer automotive replacement parts,
accessories and maintenance items. In addition, we operated 26 stores under the “Advance Auto Parts” and
“Western Auto” trade names, located in Puerto Rico and the Virgin Islands, or Offshore.