Advance Auto Parts 2010 Annual Report Download - page 91
Download and view the complete annual report
Please find page 91 of the 2010 Advance Auto Parts annual report below. You can navigate through the pages in the report by either clicking on the pages listed below, or by using the keyword search tool below to find specific information within the annual report.-
 1
1 -
2
-
3
-
4
-
5
-
6
-
7
-
8
-
9
-
10
-
11
-
12
-
13
-
14
-
15
-
16
-
17
-
18
-
19
-
20
-
21
-
22
-
23
-
24
-
25
-
26
-
27
-
28
-
29
-
30
-
31
-
32
-
33
-
34
-
35
-
36
-
37
-
38
-
39
-
40
-
41
-
42
-
43
-
44
-
45
-
46
-
47
-
48
-
49
-
50
-
51
-
52
-
53
-
54
-
55
-
56
-
57
-
58
-
59
-
60
-
61
-
62
-
63
-
64
-
65
-
66
-
67
-
68
-
69
-
70
-
71
-
72
-
73
-
74
-
75
-
76
-
77
-
78
-
79
-
80
-
 81
81 -
 82
82 -
 83
83 -
 84
84 -
 85
85 -
 86
86 -
 87
87 -
 88
88 -
 89
89 -
 90
90 -
 91
91 -
 92
92 -
 93
93 -
 94
94 -
 95
95 -
 96
96 -
 97
97 -
 98
98 -
 99
99 -
 100
100 -
 101
101 -
102
-
103
-
104
-
105
-
106
-
107
-
108
-
109
-
110
-
111
-
112
 |
 |

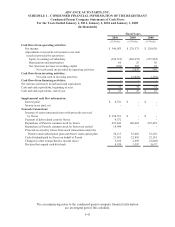
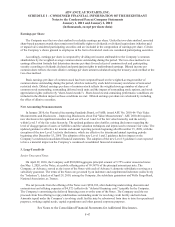
ADVANCE AUTO PARTS, INC. AND SUBSIDIARIES
NOTES TO THE CONSOLIDATED FINANCIAL STATEMENTS
January 1, 2011, January 2, 2010 and January 3, 2009
(in thousands, except per share data)
.
F-37
Performance-Based Awards
Performance shares granted in the following tables represent the performance portion of awards granted during
Fiscal 2010 at the target level, as achievement of the target level was deemed probable as of the grant date. Change
in units based on performance in the following tables represents the change in number of awards previously granted
that the Company believes will ultimately vest based on the Company’s probability assessment at January 1, 2011.
Compensation expense for performance-based awards of $5,916 and $4,276 in Fiscal 2010 and 2009,
respectively, was determined based on management’s estimate of the probable vesting outcome. During Fiscal 2008,
the Company did not recognize compensation expense for performance-based awards since vesting was
not considered probable as of January 3, 2009.
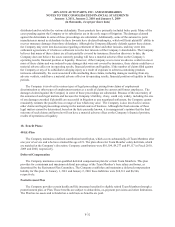
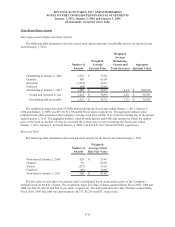
Performance-Based SARs
The following table summarizes the performance-based SARs activity for the fiscal year ended January 1, 2011:
Number of
Awards
Weighted-
Average
Exercise Price
Weighted-
Average
Remaining
Contractual
Term (in years)
Aggregate
Intrinsic Value
Outstanding at January 2, 2010 1,211 29.13$
Granted 143 65.08
Change in units based on performance 144 39.00
Exercised (2) 25.81
Forfeited (258) 29.71
Outstanding at January 1, 2011 1,238 33.34$ 5.25 40,609$
Expected to ves
t
1,143 32.37$ 5.19 38,602$
The weighted average fair value of performance-based SARs granted during the fiscal years ended January 1,
2011, January 2, 2010, and January 3, 2009 was $19.10, $12.98, and $8.66 per share, respectively. There were no
exercisable performance-based SARs at January 1, 2011. At January 1, 2011, the maximum potential payout under
the Company’s currently outstanding performance-based SAR awards was 2,274 units.
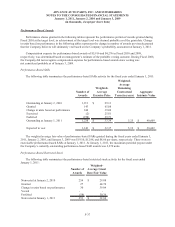
Performance-Based Restricted Stock
The following table summarizes the performance-based restricted stock activity for the fiscal year ended
January 1, 2011:
Number of
Awards
Weighted-
Average Grant
Date Fair Value
Nonvested at January 2, 2010 254 29.08$
Granted 27 64.74
Change in units based on performance 30 39.04
Vested - -
Forfeited (58) 30.36
Nonvested at January 1, 2011 253 32.84$