Advance Auto Parts 2010 Annual Report Download - page 42
Download and view the complete annual report
Please find page 42 of the 2010 Advance Auto Parts annual report below. You can navigate through the pages in the report by either clicking on the pages listed below, or by using the keyword search tool below to find specific information within the annual report.-
 1
1 -
2
-
3
-
4
-
5
-
6
-
7
-
8
-
9
-
10
-
11
-
12
-
13
-
14
-
15
-
16
-
17
-
18
-
19
-
20
-
21
-
22
-
23
-
24
-
25
-
26
-
27
-
28
-
29
-
30
-
31
-
 32
32 -
 33
33 -
 34
34 -
 35
35 -
 36
36 -
 37
37 -
 38
38 -
 39
39 -
 40
40 -
 41
41 -
 42
42 -
 43
43 -
 44
44 -
 45
45 -
 46
46 -
 47
47 -
 48
48 -
 49
49 -
 50
50 -
 51
51 -
 52
52 -
53
-
54
-
55
-
56
-
57
-
58
-
59
-
60
-
61
-
62
-
63
-
64
-
65
-
66
-
67
-
68
-
69
-
70
-
71
-
72
-
73
-
74
-
75
-
76
-
77
-
78
-
79
-
80
-
81
-
82
-
83
-
84
-
85
-
86
-
87
-
88
-
89
-
90
-
91
-
92
-
93
-
94
-
95
-
96
-
97
-
98
-
99
-
100
-
101
-
102
-
103
-
104
-
105
-
106
-
107
-
108
-
109
-
110
-
111
-
112
 |
 |

27
Income Taxes
Income tax expense for Fiscal 2009 was $161.3 million, as compared to $142.7 million for Fiscal 2008. Our
effective income tax rate was 37.4% and 37.5% for Fiscal 2009 and Fiscal 2008, respectively.
Net Income
Net income was $270.4 million, or $2.83 per diluted share, for Fiscal 2009, as compared to $238.0 million, or
$2.49 per diluted share, for Fiscal 2008. As a percentage of net sales, net income for Fiscal 2009 was 5.0%, as
compared to 4.6% for Fiscal 2008. The increase in diluted earnings per share was primarily due to growth in our
operating income.
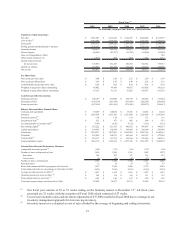
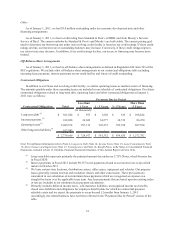
Quarterly Consolidated Financial Results (in thousands, except per share data)
16-Weeks 12-Weeks 12-Weeks 12-Weeks 16-Weeks 12-Weeks 12-Weeks 12-Weeks
Ended Ended Ended Ended Ended Ended Ended Ended
4/25/2009 7/18/2009 10/10/2009 1/2/2010 4/24/2010 7/17/2010 10/9/2010 1/1/2011
Net sales 1,683,636$ 1,322,844$ 1,262,576$ 1,143,567$ 1,830,606$ 1,417,956$ 1,406,511$ 1,270,130$
Gross profit 821,988 652,650 621,459 548,129 910,777 715,268 707,785 627,485
Net income 93,585 80,330 61,979 34,479 109,431 100,911 87,598 48,113
Net income per share:
Basic 0.99$ 0.84$ 0.65$ 0.37$ 1.20$ 1.18$ 1.04$ 0.58$
Diluted 0.98$ 0.83$ 0.65$ 0.36$ 1.19$ 1.16$ 1.03$ 0.57$
Liquidity and Capital Resources
Overview of Liquidity
Our primary cash requirements to maintain our current operations include payroll and benefits, the purchase of
inventory, contractual obligations and capital expenditures as well as the payment of quarterly cash dividends and
income tax payments. In addition, we have used available funds to repay borrowings under our revolving credit
facility and periodically repurchase shares of our common stock under our stock repurchase program. We have
funded these requirements primarily through cash generated from operations, supplemented by borrowings under
our credit facilities as needed. We believe funds generated from our expected results of operations, available cash
and cash equivalents, and available borrowings under our revolving credit facility will be sufficient to fund our
primary obligations for the next fiscal year.
At January 1, 2011, our cash and cash equivalents balance was $59.2 million, a decrease of $40.8 million
compared to January 2, 2010 (the end of Fiscal 2009). This decrease in cash primarily resulted from the use of our
available cash from operations and long-term borrowings to purchase property and equipment and repurchase shares
of our common stock. Additional discussion of our cash flow results, including the comparison of Fiscal 2010
activity to Fiscal 2009, is set forth in the Analysis of Cash Flows section.
At January 1, 2011, our outstanding indebtedness was $301.8 million, or $97.6 million higher when compared
to January 2, 2010, and consisted of borrowings of $298.8 million under our senior unsecured notes, $2.6 million
outstanding on an economic development note and $0.4 million outstanding under other financing arrangements.
Additionally, we had $92.6 million in letters of credit outstanding, which reduced our total availability under our
revolving credit facility to $657.4 million. The letters of credit serve as collateral for our self-insurance policies and
our routine purchases of imported merchandise.