Advance Auto Parts 2010 Annual Report Download - page 77
Download and view the complete annual report
Please find page 77 of the 2010 Advance Auto Parts annual report below. You can navigate through the pages in the report by either clicking on the pages listed below, or by using the keyword search tool below to find specific information within the annual report.-
 1
1 -
2
-
3
-
4
-
5
-
6
-
7
-
8
-
9
-
10
-
11
-
12
-
13
-
14
-
15
-
16
-
17
-
18
-
19
-
20
-
21
-
22
-
23
-
24
-
25
-
26
-
27
-
28
-
29
-
30
-
31
-
32
-
33
-
34
-
35
-
36
-
37
-
38
-
39
-
40
-
41
-
42
-
43
-
44
-
45
-
46
-
47
-
48
-
49
-
50
-
51
-
52
-
53
-
54
-
55
-
56
-
57
-
58
-
59
-
60
-
61
-
62
-
63
-
64
-
65
-
66
-
 67
67 -
 68
68 -
 69
69 -
 70
70 -
 71
71 -
 72
72 -
 73
73 -
 74
74 -
 75
75 -
 76
76 -
 77
77 -
 78
78 -
 79
79 -
 80
80 -
 81
81 -
 82
82 -
 83
83 -
 84
84 -
 85
85 -
 86
86 -
 87
87 -
88
-
89
-
90
-
91
-
92
-
93
-
94
-
95
-
96
-
97
-
98
-
99
-
100
-
101
-
102
-
103
-
104
-
105
-
106
-
107
-
108
-
109
-
110
-
111
-
112
 |
 |

ADVANCE AUTO PARTS, INC. AND SUBSIDIARIES
NOTES TO THE CONSOLIDATED FINANCIAL STATEMENTS
January 1, 2011, January 2, 2010 and January 3, 2009
(in thousands, except per share data)
.
F-23
determined using pricing models for which the assumptions utilize management’s estimates of market
participant assumptions.
Assets and Liabilities Measured at Fair Value on a Recurring Basis
The fair value hierarchy requires the use of observable market data when available. In instances where inputs
used to measure fair value fall into different levels of the fair value hierarchy, the fair value measurement has been
determined based on the lowest level input that is significant to the fair value measurement in its entirety. Our
assessment of the significance of a particular item to the fair value measurement in its entirety requires judgment,
including the consideration of inputs specific to the asset or liability.
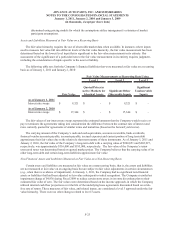
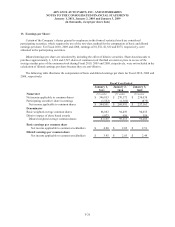
The following table sets forth the Company’s financial liabilities that were measured at fair value on a recurring
basis as of January 1, 2011 and January 2, 2010:
Level 1 Level 2 Level 3
Quoted Prices in Significant
Active Markets for Significant Other Unobservable
Fair Value Identical Assets Observable Inputs Inputs
As of January 1, 2011
Interest rate swaps 9,321$ -$ 9,321$ -$
As of January 2, 2010
Interest rate swaps 17,344$ -$ 17,344$ -$
Fair Value Measurements at Reporting Date Using
The fair values of our interest rate swaps represent the estimated amounts that the Company would receive or
pay to terminate the agreements taking into consideration the difference between the contract rate of interest and
rates currently quoted for agreements of similar terms and maturities (based on the forward yield curve).
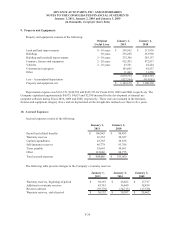
The carrying amount of the Company’s cash and cash equivalents, accounts receivable, bank overdrafts,
financed vendor accounts payable, accounts payable, accrued expenses and current portion of long term debt
approximate their fair values due to the relatively short term nature of these instruments. As of January 1, 2011 and
January 2, 2010, the fair value of the Company’s long-term debt with a carrying value of $300,851 and $202,927,
respectively, was approximately $316,000 and $195,000, respectively. The fair value of the Company’s senior
unsecured notes was determined based on quoted market prices. The Company believes that the carrying value of its
other long-term debt and certain long-term liabilities approximate fair value.
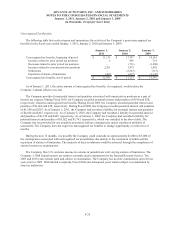
Non-Financial Assets and Liabilities Measured at Fair Value on a Non-Recurring Basis
Certain assets and liabilities are measured at fair value on a nonrecurring basis; that is, the assets and liabilities
are not measured at fair value on an ongoing basis but are subject to fair value adjustments in certain circumstances
(e.g., when there is evidence of impairment). At January 1, 2011, the Company had no significant non-financial
assets or liabilities that had been adjusted to fair value subsequent to initial recognition. The Company recorded an
impairment charge of $4,936 during Fiscal 2009 to reduce certain store assets in its store divestiture plan to their
estimated fair value of zero. The fair values were determined based on the income approach, in which the Company
utilized internal cash flow projections over the life of the underlying lease agreements discounted based on a risk-
free rate of return. These measures of fair value, and related inputs, are considered a level 3 approach under the fair
value hierarchy. There were no other changes related to level 3 assets.