Advance Auto Parts 2010 Annual Report Download - page 90
Download and view the complete annual report
Please find page 90 of the 2010 Advance Auto Parts annual report below. You can navigate through the pages in the report by either clicking on the pages listed below, or by using the keyword search tool below to find specific information within the annual report.-
 1
1 -
2
-
3
-
4
-
5
-
6
-
7
-
8
-
9
-
10
-
11
-
12
-
13
-
14
-
15
-
16
-
17
-
18
-
19
-
20
-
21
-
22
-
23
-
24
-
25
-
26
-
27
-
28
-
29
-
30
-
31
-
32
-
33
-
34
-
35
-
36
-
37
-
38
-
39
-
40
-
41
-
42
-
43
-
44
-
45
-
46
-
47
-
48
-
49
-
50
-
51
-
52
-
53
-
54
-
55
-
56
-
57
-
58
-
59
-
60
-
61
-
62
-
63
-
64
-
65
-
66
-
67
-
68
-
69
-
70
-
71
-
72
-
73
-
74
-
75
-
76
-
77
-
78
-
79
-
 80
80 -
 81
81 -
 82
82 -
 83
83 -
 84
84 -
 85
85 -
 86
86 -
 87
87 -
 88
88 -
 89
89 -
 90
90 -
 91
91 -
 92
92 -
 93
93 -
 94
94 -
 95
95 -
 96
96 -
 97
97 -
 98
98 -
 99
99 -
 100
100 -
101
-
102
-
103
-
104
-
105
-
106
-
107
-
108
-
109
-
110
-
111
-
112
 |
 |

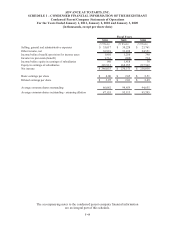
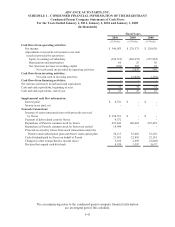
ADVANCE AUTO PARTS, INC. AND SUBSIDIARIES
NOTES TO THE CONSOLIDATED FINANCIAL STATEMENTS
January 1, 2011, January 2, 2010 and January 3, 2009
(in thousands, except per share data)
.
F-36
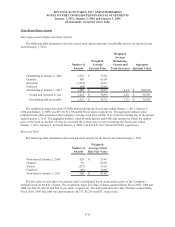
Time-Based Share Awards
Stock Appreciation Rights and Stock Options
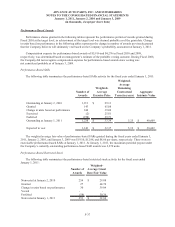
The following table summarizes the time-vested stock option and time-vested SARs activity for the fiscal year
ended January 1, 2011:
Number of
Awards
Weighted-
Average
Exercise Price
Weighted-
Average
Remaining
Contractual
Term (in years)
Aggregate
Intrinsic Value
Outstanding at January 2, 2010 5,276 35.20$
Granted 430 65.08
Exercised (1,934) 34.81
Forfeited (84) 33.92
Outstanding at January 1, 2011 3,688 38.93$ 4.14 100,395$
Vested and expected to ves
t
3,621 38.59$ 4.10 99,787$
Outstanding and exercisable 2,319 35.79$ 3.32 70,393$
The weighted average fair value of SARs granted during the fiscal years ended January 1, 2011, January 2,
2010 and January 3, 2009, was $19.10, $12.98 and $8.66 per share, respectively. The aggregate intrinsic value
reflected in the table is based on the Company’s closing stock price of $66.15 as of the last trading day of the period
ended January 1, 2011. The aggregate intrinsic value of stock options and SARs (the amount by which the market
price of the stock on the date of exercise exceeded the exercise price) exercised during the fiscal years ended
January 1, 2011, January 2, 2010 and January 3, 2009, was $35,447, $12,704 and $25,890, respectively.
Restricted Stock
The following table summarizes the restricted stock activity for the fiscal year ended January 1, 2011:
Number of
Awards
Weighted-
Average Grant
Date Fair Value
Nonvested at January 2, 2010 559 35.40$
Granted 82 64.58
Vested (237) 35.16
Forfeited (20) 34.80
Nonvested at January 1, 2011 384 41.86$
The fair value of each share of restricted stock is determined based on the market price of the Company’s
common stock on the date of grant. The weighted average fair value of shares granted during Fiscal 2010, 2009 and
2008 was $64.58, $39.53 and $32.21 per share, respectively. The total grant date fair value of shares vested during
Fiscal 2010, 2009 and 2008 was approximately $8,317, $3,238 and $53, respectively.