Advance Auto Parts 2010 Annual Report Download - page 2
Download and view the complete annual report
Please find page 2 of the 2010 Advance Auto Parts annual report below. You can navigate through the pages in the report by either clicking on the pages listed below, or by using the keyword search tool below to find specific information within the annual report.-
 1
1 -
 2
2 -
 3
3 -
 4
4 -
 5
5 -
 6
6 -
 7
7 -
 8
8 -
 9
9 -
 10
10 -
 11
11 -
 12
12 -
 13
13 -
14
-
15
-
16
-
17
-
18
-
19
-
20
-
21
-
22
-
23
-
24
-
25
-
26
-
27
-
28
-
29
-
30
-
31
-
32
-
33
-
34
-
35
-
36
-
37
-
38
-
39
-
40
-
41
-
42
-
43
-
44
-
45
-
46
-
47
-
48
-
49
-
50
-
51
-
52
-
53
-
54
-
55
-
56
-
57
-
58
-
59
-
60
-
61
-
62
-
63
-
64
-
65
-
66
-
67
-
68
-
69
-
70
-
71
-
72
-
73
-
74
-
75
-
76
-
77
-
78
-
79
-
80
-
81
-
82
-
83
-
84
-
85
-
86
-
87
-
88
-
89
-
90
-
91
-
92
-
93
-
94
-
95
-
96
-
97
-
98
-
99
-
100
-
101
-
102
-
103
-
104
-
105
-
106
-
107
-
108
-
109
-
110
-
111
-
112
 |
 |
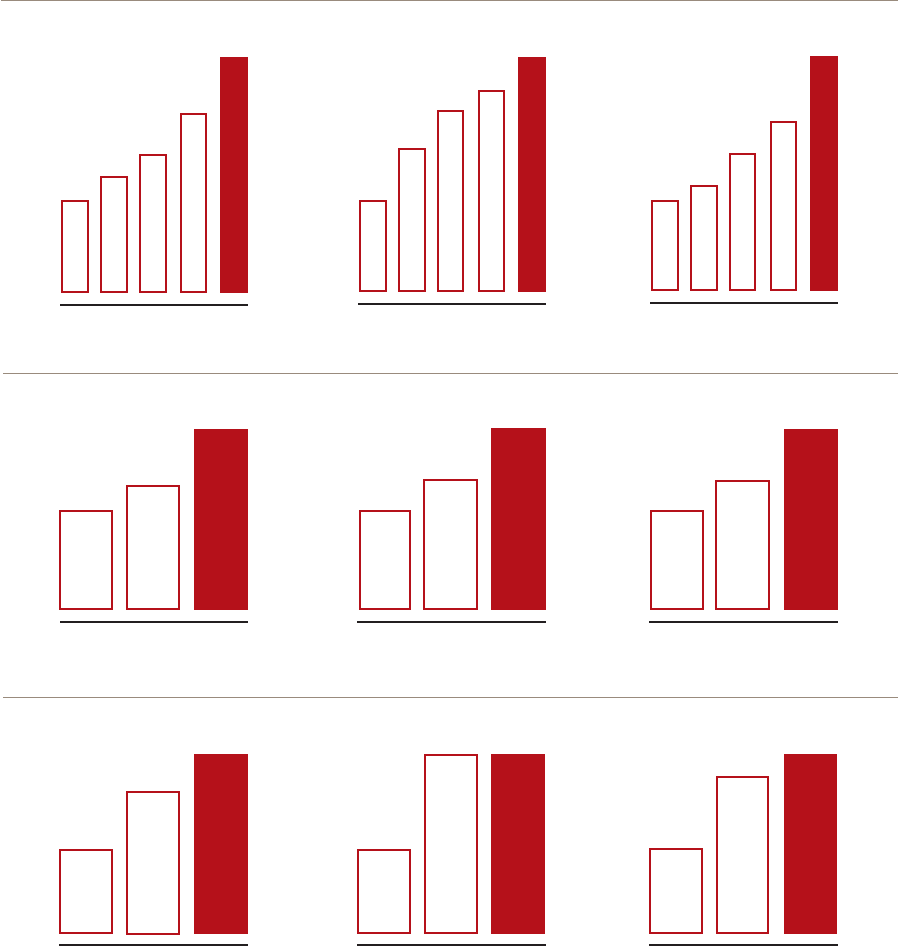
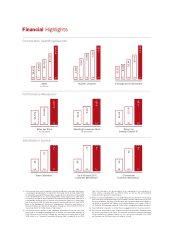
Financial Highlights
Comparable Operating Results(1)
06
$4,617
$4,844
$5,053
$5,413
$5,925
07 08 09 10
Sales
(in millions)
06
3,082
3,261
3,368
3,420
3,563
07 08 09 10
Number of Stores
06
$2.16
$2.28
$2.64
$3.00
$3.95
07 08 09 10
Earnings per Diluted Share
(1) Our scal year sales results reported in the referenced charts have been reported on
a comparable operating basis to exclude the 53rd week results in scal 2008. Refer
to “Selected Consolidated Financial Data” on page 18 of our 2010 Form 10-K included
in this Annual Report for the corresponding sales results reported on a GAAP basis.
Our earnings per diluted share reported in the referenced chart has been reported on
a comparable operating basis to exclude store divestiture expenses in scal 2009
and the results from the 53rd week and non-cash inventory adjustment in scal 2008.
Refer to the Management Overview of “Management’s Discussion and Analysis of
Financial Condition and Results of Operations” on page 21 of our 2010 Form 10 -K in
this Annual Report for further details of these items.
(2) Our nancial results reported in the referenced performance measures have been
reported on a comparable operating basis to exclude store divestiture expenses in
scal 2009 and results from the 53rd week and non-cash inventory adjustment in scal
2008. Refer to the “Selected Consolidated Financial Data” on page 18 of our 2010
Form 10-K included in this Annual Report for an explanation of the calculation of
these metrics, excluding ROIC as de ned below, as well as the corresponding
nancial results reported on a GAAP basis.
(3) Return on invested capital (ROIC) is a non- GAAP measure and is de ned as net operating
pro t after taxes divided by average invested capital. Invested capital consists of total
assets and liabilities, excluding cash and debt, and estimated capital lease obligation
calculated as annualized rent expense for the applicable year times 6 years. Refer to
our 4th quarter 2010 earnings release for further details, including the detailed calculation.
(4) Team Calibration measures our overall Team’s engagement in our business direction.
(5) The Customer Satisfaction surveys measure the level of our customers’ satisfaction with
the service they receive in our stores. The Customer Satisfaction scores are calculated
using a twelve-month average. However, our rst survey was conducted in fall 2008
and therefore the 2008 score does not re ect a full year.
Satisfaction Scores
75
79
09 10
Team Calibration(4)
65
08
73
73
09 10
Do It Yourself (DIY)
Customer Satisfaction(5)
65
08
64
65
09 10
Commercial
Customer Satisfaction(5)
60
08
Performance Measures(2)
08
$1,524
$1,595
$1,697
09 10
Sales per Store
(in thousands)
$132
$142
$168
Operating Income per Store
(in thousands)
08 09 10
14.0%
15.1%
17.5%
Return on
Invested Capital %(3)
08 09 10