3M 2009 Annual Report Download - page 97
Download and view the complete annual report
Please find page 97 of the 2009 3M annual report below. You can navigate through the pages in the report by either clicking on the pages listed below, or by using the keyword search tool below to find specific information within the annual report.-
 1
1 -
2
-
3
-
4
-
5
-
6
-
7
-
8
-
9
-
10
-
11
-
12
-
13
-
14
-
15
-
16
-
17
-
18
-
19
-
20
-
21
-
22
-
23
-
24
-
25
-
26
-
27
-
28
-
29
-
30
-
31
-
32
-
33
-
34
-
35
-
36
-
37
-
38
-
39
-
40
-
41
-
42
-
43
-
44
-
45
-
46
-
47
-
48
-
49
-
50
-
51
-
52
-
53
-
54
-
55
-
56
-
57
-
58
-
59
-
60
-
61
-
62
-
63
-
64
-
65
-
66
-
67
-
68
-
69
-
70
-
71
-
72
-
73
-
74
-
75
-
76
-
77
-
78
-
79
-
80
-
81
-
82
-
83
-
84
-
85
-
86
-
 87
87 -
 88
88 -
 89
89 -
 90
90 -
 91
91 -
 92
92 -
 93
93 -
 94
94 -
 95
95 -
 96
96 -
 97
97 -
 98
98 -
 99
99 -
 100
100 -
 101
101 -
 102
102 -
 103
103 -
 104
104 -
 105
105 -
 106
106 -
 107
107 -
108
-
109
-
110
-
111
-
112
-
113
-
114
-
115
-
116
-
117
-
118
-
119
-
120
-
121
-
122
-
123
-
124
-
125
-
126
-
127
-
128
-
129
-
130
-
131
-
132
 |
 |

91
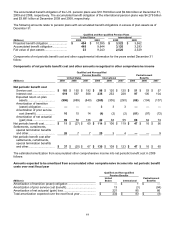
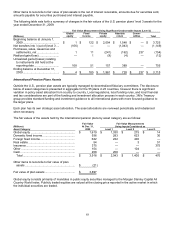
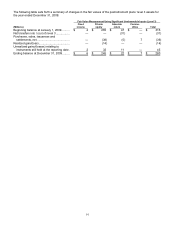
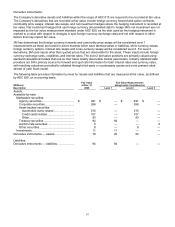
The following table sets forth a summary of changes in the fair values of the postretirement plans’ level 3 assets for
the year ended December 31, 2009:
Fair Value Measurement Using Significant Unobservable Inputs (Level 3)
(Millions)
Fixed
income
Private
equity
Absolute
return
Commo-
dities Total
Beginning balance at January 1, 2009.......... $ 4 $ 265 $ 47 $ — $ 316
Net transfers into / (out of) level 3 ................. —
—
(31)
—
(31)
Purchases, sales, issuances and
settlements, net ......................................... — (38) (5) 7 (36)
Realized gain/(loss)....................................... — (14) —
—
(14)
Unrealized gains/(losses) relating to
instruments still held at the reporting date.
2 32 11
—
45
Ending balance at December 31, 2009......... $ 6 $ 245 $ 22 $ 7 $ 280