3M 2009 Annual Report Download - page 22
Download and view the complete annual report
Please find page 22 of the 2009 3M annual report below. You can navigate through the pages in the report by either clicking on the pages listed below, or by using the keyword search tool below to find specific information within the annual report.-
 1
1 -
2
-
3
-
4
-
5
-
6
-
7
-
8
-
9
-
10
-
11
-
 12
12 -
 13
13 -
 14
14 -
 15
15 -
 16
16 -
 17
17 -
 18
18 -
 19
19 -
 20
20 -
 21
21 -
 22
22 -
 23
23 -
 24
24 -
 25
25 -
 26
26 -
 27
27 -
 28
28 -
 29
29 -
 30
30 -
 31
31 -
 32
32 -
33
-
34
-
35
-
36
-
37
-
38
-
39
-
40
-
41
-
42
-
43
-
44
-
45
-
46
-
47
-
48
-
49
-
50
-
51
-
52
-
53
-
54
-
55
-
56
-
57
-
58
-
59
-
60
-
61
-
62
-
63
-
64
-
65
-
66
-
67
-
68
-
69
-
70
-
71
-
72
-
73
-
74
-
75
-
76
-
77
-
78
-
79
-
80
-
81
-
82
-
83
-
84
-
85
-
86
-
87
-
88
-
89
-
90
-
91
-
92
-
93
-
94
-
95
-
96
-
97
-
98
-
99
-
100
-
101
-
102
-
103
-
104
-
105
-
106
-
107
-
108
-
109
-
110
-
111
-
112
-
113
-
114
-
115
-
116
-
117
-
118
-
119
-
120
-
121
-
122
-
123
-
124
-
125
-
126
-
127
-
128
-
129
-
130
-
131
-
132
 |
 |

16
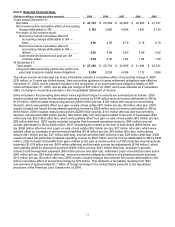
losses related to the sale of businesses ($23 million pre-tax, $32 million after-tax), which were partially offset by a
gain on sale of real estate ($41 million pre-tax, $28 million after-tax). Divestiture impacts, restructuring actions and
exit activities are discussed in more detail in Note 2 (Acquisitions and Divestitures) and Note 4 (Restructuring Actions
and Exit Activities). Concerning the real estate gain, 3M received proceeds and recorded a gain in 2008 for a sale-
leaseback transaction relative to an administrative location in Italy.
In 2007, gains on sale of businesses and real estate, net of restructuring and other items, increased operating
income by $681 million and net income attributable to 3M by $448 million, or $0.62 per diluted share. 2007 included
net benefits from gains related to the sale of businesses ($849 million pre-tax, $550 million after-tax) and a gain on
sale of real estate ($52 million pre-tax, $37 million after-tax), which were partially offset by increases in other
environmental liabilities ($134 million pre-tax, $83 million after-tax), restructuring actions ($41 million pre-tax, $27
million after-tax), and other exit activities ($45 million pre-tax, $29 million after-tax). These items, except the gain on
sale of real estate, are discussed in more detail in Note 2 (Acquisitions and Divestitures), Note 4 (Restructuring
Actions and Exit Activities) and Note 14 (Commitments and Contingencies). Gains on sale of businesses include the
second-quarter 2007 sale of 3M’s Opticom Priority Control Systems and Canoga Traffic Detection businesses, and
the first-quarter 2007 sale of the global branded pharmaceuticals business in Europe. Concerning the real estate
sale, 3M sold a laboratory facility located in Suwon, Korea.
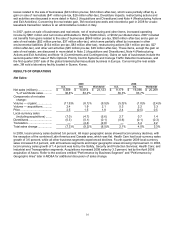
RESULTS OF OPERATIONS
Net Sales:
2009 2008
U.S. Intl. Worldwide U.S. Intl. Worldwide
Net sales (millions).................. $ 8,509 $ 14,614 $ 23,123 $ 9,179 $ 16,090 $ 25,269
% of worldwide sales ........... 36.8% 63.2% 36.3% 63.7%
Components of net sales
change:
Volume — organic................... (11.9)% (8.1)% (9.5)% (5.0)% (1.0)% (2.4)%
Volume — acquisitions............ 2.4 1.9 2.1 5.3 2.2 3.3
Price ........................................ 2.5 1.5 1.8 2.4 (0.5) 0.5
Local-currency sales
(including acquisitions) ........ (7.0) (4.7) (5.6) 2.7 0.7 1.4
Divestitures.............................. (0.3) (0.1) (0.1) (0.6) (0.1) (0.3)
Translation............................... — (4.4) (2.8) — 3.4 2.2
Total sales change .................. (7.3)% (9.2)% (8.5)% 2.1% 4.0% 3.3%
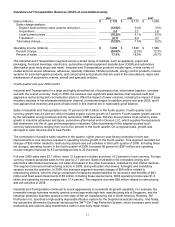
In 2009, local-currency sales declined 5.6 percent. All major geographic areas showed local-currency declines, with
the exception of the combined Latin America and Canada area, which was flat. Health Care had local-currency sales
growth of 3.6 percent, while all other business segments experienced declines. Fourth-quarter 2009 local-currency
sales increased 6.4 percent, with all business segments and major geographic areas showing improvement. In 2008,
local-currency sales growth of 1.4 percent was led by the Safety, Security and Protection Services; Health Care; and
Industrial and Transportation segments. Acquisitions increased 2008 sales by 3.3 percent, led by the April 2008
acquisition of Aearo. Refer to the sections entitled “Performance by Business Segment” and “Performance by
Geographic Area” later in MD&A for additional discussion of sales change.