3M 2009 Annual Report Download - page 20
Download and view the complete annual report
Please find page 20 of the 2009 3M annual report below. You can navigate through the pages in the report by either clicking on the pages listed below, or by using the keyword search tool below to find specific information within the annual report.-
 1
1 -
2
-
3
-
4
-
5
-
6
-
7
-
8
-
9
-
 10
10 -
 11
11 -
 12
12 -
 13
13 -
 14
14 -
 15
15 -
 16
16 -
 17
17 -
 18
18 -
 19
19 -
 20
20 -
 21
21 -
 22
22 -
 23
23 -
 24
24 -
 25
25 -
 26
26 -
 27
27 -
 28
28 -
 29
29 -
 30
30 -
31
-
32
-
33
-
34
-
35
-
36
-
37
-
38
-
39
-
40
-
41
-
42
-
43
-
44
-
45
-
46
-
47
-
48
-
49
-
50
-
51
-
52
-
53
-
54
-
55
-
56
-
57
-
58
-
59
-
60
-
61
-
62
-
63
-
64
-
65
-
66
-
67
-
68
-
69
-
70
-
71
-
72
-
73
-
74
-
75
-
76
-
77
-
78
-
79
-
80
-
81
-
82
-
83
-
84
-
85
-
86
-
87
-
88
-
89
-
90
-
91
-
92
-
93
-
94
-
95
-
96
-
97
-
98
-
99
-
100
-
101
-
102
-
103
-
104
-
105
-
106
-
107
-
108
-
109
-
110
-
111
-
112
-
113
-
114
-
115
-
116
-
117
-
118
-
119
-
120
-
121
-
122
-
123
-
124
-
125
-
126
-
127
-
128
-
129
-
130
-
131
-
132
 |
 |

14
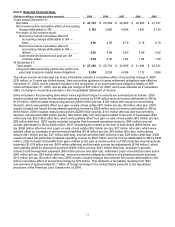
Sales in 2009 totaled $23.1 billion, a decrease of 8.5 percent from 2008. Including the preceding special items, net
income attributable to 3M was $3.193 billion, or $4.52 per diluted share, in 2009, versus $3.460 billion, or $4.89 per
diluted share, in 2008. In 2009, the global economic slowdown dramatically affected year-on-year comparisons for
3M’s businesses. Substantial end-market declines and inventory takedowns in major industries, including
automotive, consumer electronics and general industrial manufacturing, resulted in significantly lower sales and
income. Accordingly, 3M reduced its cost structure, lowered manufacturing output and intensified its attention to
operational improvement. The combination of these actions drove operating income margins of 20.8 percent in 2009,
compared to 20.6 percent in 2008. Restructuring charges and other special items reduced this operating income
margin by approximately one percentage point in both 2009 and 2008.
In January 2007, 3M completed the sale of its branded pharmaceuticals business, resulting in a gain in the first
quarter of 2007. In addition, 3M recorded a gain related to the sale of its Opticom Priority Control Systems and
Canoga Traffic Detection businesses in the second quarter of 2007. In 2007, these gains on sale of businesses were
partially offset by restructuring and the net impact of other special items. Refer to “Special Items” at the end of this
overview section for additional details. Including these special items, in 2007, 3M reported net sales of $24.462 billion
and net income attributable to 3M of $4.096 billion, or $5.60 per diluted share.
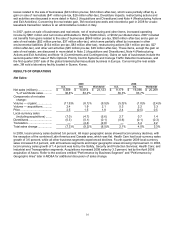
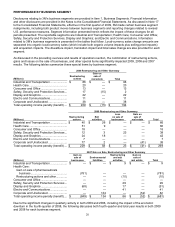
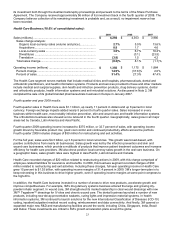
The following table contains sales and operating income results by business segment for the years ended
December 31, 2009 and 2008. Refer to the section entitled “Performance by Business Segment” later in MD&A for
discussion by business segment of restructuring and other items that impacted reported operating income. Refer to
Note 17 for discussion of Corporate and Unallocated and Elimination of Dual Credit.
2009 2008
2009 vs. 2008
% change
(Dollars in millions)
Net
Sales
% of
Total
Oper.
Income
Net
Sales
% of
Total
Oper.
Income
Net
Sales
Oper.
Income
Business Segments
Industrial and
Transportation.......... $ 7,116 30.8% $ 1,238 $ 8,173 32.3% $ 1,548 (12.9)% (20.0)%
Health Care ................. 4,294 18.6% 1,350 4,303 17.0% 1,175 (0.2)% 14.9%
Consumer and Office .. 3,471 15.0% 748 3,578 14.2% 683 (3.0)% 9.5%
Safety, Security and
Protection Services.. 3,180 13.8% 745 3,450 13.7% 710 (7.8)% 5.0%
Display and Graphics .. 3,132 13.5% 590 3,268 12.9% 583 (4.2)% 1.3%
Electro and
Communications ...... 2,276 9.8% 322 2,835 11.2% 540 (19.7)% (40.4)%
Corporate and
Unallocated.............. 12 0.1% (100) 23 0.1% 58
Elimination of Dual
Credit ....................... (358) (1.6)% (79) (361) (1.4)% (79)
Total Company ............ $ 23,123 100.0% $ 4,814 $ 25,269 100.0% $ 5,218 (8.5)% (7.7)%
In 2009, while sales declined 8.5 percent for the total year, this was similar to the overall economy and close to the
estimated decline in worldwide industrial production. Quarterly year-on-year comparisons improved throughout 2009.
Sales declined 21.3 percent in the first quarter, 15.1 percent in the second quarter and 5.6 percent in the third
quarter, but improved 11.1 percent in the fourth quarter. Refer to the sections entitled “Performance by Business
Segment” and “Performance by Geographic Area” later in MD&A for additional discussion of sales change.
In 2008, worldwide sales growth was 3.3 percent. Local-currency sales growth was 1.4 percent for 2008, including a
3.3 percentage point benefit from acquisitions. Local-currency sales increased 17.1 percent in Safety, Security and
Protection Services (including 13.0 percentage points from acquisitions), 6.7 percent in Health Care (including 1.7
percentage points from acquisitions), 4.1 percent in Industrial and Transportation (including 3.7 percentage points
from acquisitions), and 1.0 percent in Consumer and Office (including 1.8 percentage points from acquisitions).
Local-currency sales declined 1.6 percent in Electro and Communications and 17.9 percent in Display and Graphics.
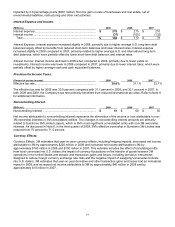
3M generated $4.9 billion of operating cash flows in 2009, an increase of $408 million when compared to 2008. This
followed an increase of $287 million when comparing 2008 to 2007. In 2009, 2008 and 2007, the Company utilized
approximately $1.4 billion of cash each year to pay dividends. In February 2007, 3M’s Board of Directors authorized
a two-year share repurchase of up to $7.0 billion for the period from February 12, 2007 to February 28, 2009. In
February 2009, 3M’s Board of Directors extended this share repurchase authorization until the remaining amount is
fully utilized. As of December 31, 2009, approximately $2.6 billion remained available for repurchase. With the
Company’s emphasis on maintaining ample liquidity and enhancing balance sheet strength, share repurchase