3M 2009 Annual Report Download - page 44
Download and view the complete annual report
Please find page 44 of the 2009 3M annual report below. You can navigate through the pages in the report by either clicking on the pages listed below, or by using the keyword search tool below to find specific information within the annual report.-
 1
1 -
2
-
3
-
4
-
5
-
6
-
7
-
8
-
9
-
10
-
11
-
12
-
13
-
14
-
15
-
16
-
17
-
18
-
19
-
20
-
21
-
22
-
23
-
24
-
25
-
26
-
27
-
28
-
29
-
30
-
31
-
32
-
33
-
 34
34 -
 35
35 -
 36
36 -
 37
37 -
 38
38 -
 39
39 -
 40
40 -
 41
41 -
 42
42 -
 43
43 -
 44
44 -
 45
45 -
 46
46 -
 47
47 -
 48
48 -
 49
49 -
 50
50 -
 51
51 -
 52
52 -
 53
53 -
 54
54 -
55
-
56
-
57
-
58
-
59
-
60
-
61
-
62
-
63
-
64
-
65
-
66
-
67
-
68
-
69
-
70
-
71
-
72
-
73
-
74
-
75
-
76
-
77
-
78
-
79
-
80
-
81
-
82
-
83
-
84
-
85
-
86
-
87
-
88
-
89
-
90
-
91
-
92
-
93
-
94
-
95
-
96
-
97
-
98
-
99
-
100
-
101
-
102
-
103
-
104
-
105
-
106
-
107
-
108
-
109
-
110
-
111
-
112
-
113
-
114
-
115
-
116
-
117
-
118
-
119
-
120
-
121
-
122
-
123
-
124
-
125
-
126
-
127
-
128
-
129
-
130
-
131
-
132
 |
 |

38
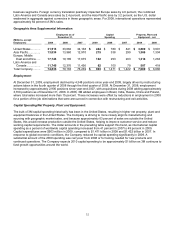
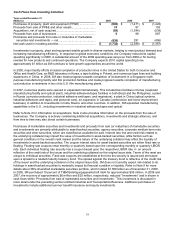
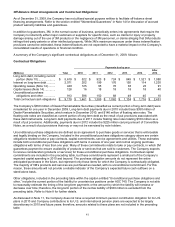
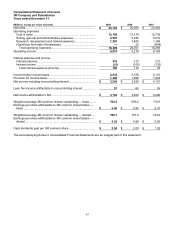
Cash flows from operating, investing and financing activities are provided in the tables that follow. Individual amounts
in the Consolidated Statement of Cash Flows exclude the effects of acquisitions, divestitures and exchange rate
impacts, which are presented separately in the cash flows. Thus, the amounts presented in the following operating,
investing and financing activities tables reflect changes in balances from period to period adjusted for these effects.
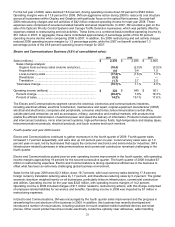
Cash Flows from Operating Activities:
Years ended December 31
(Millions) 2009 2008 2007
Net income including noncontrolling interest ................................. $ 3,244 $ 3,520 $ 4,151
Depreciation and amortization ....................................................... 1,157 1,153 1,072
Company pension contributions..................................................... (659) (421) (376)
Company postretirement contributions .......................................... (133) (53) (3)
Company pension expense............................................................ 176 89 190
Company postretirement expense ................................................. 47 16 65
Stock-based compensation expense ............................................. 217 202 228
Loss/(gain) from sale of businesses...............................................
—
23 (849)
Income taxes (deferred and accrued income taxes)...................... 554 (44) (34)
Excess tax benefits from stock-based compensation .................... (14) (21) (74)
Accounts receivable ....................................................................... 55 197 (35)
Inventories...................................................................................... 453 (127) (54)
Accounts payable ........................................................................... 109 (224) (4)
Product and other insurance receivables and claims .................... 64 153 158
Other — net.................................................................................... (329) 70 (189)
Net cash provided by operating activities....................................... $ 4,941 $ 4,533 $ 4,246
Cash flows from operating activities can fluctuate significantly from period to period, as pension funding decisions,
tax timing differences and other items can significantly impact cash flows. In the third quarter of 2009, the Company
contributed $600 million to its U.S. defined benefit pension plan in shares of the Company’s common stock, which is
considered a non-cash financing activity. This non-cash activity is not reflected in the operating or financing section
of the cash flows.
In 2009, cash flows provided by operating activities increased $408 million compared to 2008. The main positive
contribution to operating cash flows related to year-on-year working capital improvements of $771 million (which
includes accounts receivable, inventories and accounts payable). In addition, lower cash tax payments in 2009
benefited cash flows. These positive contributions were partially offset by a decrease of $276 million in net income
including noncontrolling interest. The category, “Other-net,” in the preceding table reflects changes in other asset and
liability accounts. This includes the impact of cash outlays for restructuring payments, net of restructuring expenses,
which on a combined basis reduced liabilities (Note 4). In addition, decreases in banked vacation accruals reduced
liabilities.
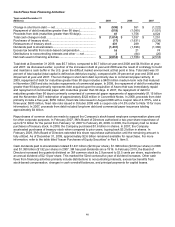
In 2008, cash flows provided by operating activities increased $287 million. Net income including noncontrolling
interest decreased $631 million, primarily due to gains from the sale of businesses in 2007 which did not repeat in
2008. Accounts receivable decreases benefited cash flows in 2008, but increases in inventories and decreases in
accounts payable negatively impacted cash flows. The category “Other-net” in the preceding table reflects changes
in other asset and liability accounts, including outstanding liabilities at December 31, 2008 related to 3M’s
restructuring actions (Note 4).