3M 2009 Annual Report Download - page 6
Download and view the complete annual report
Please find page 6 of the 2009 3M annual report below. You can navigate through the pages in the report by either clicking on the pages listed below, or by using the keyword search tool below to find specific information within the annual report.-
 1
1 -
 2
2 -
 3
3 -
 4
4 -
 5
5 -
 6
6 -
 7
7 -
 8
8 -
 9
9 -
 10
10 -
 11
11 -
 12
12 -
 13
13 -
 14
14 -
 15
15 -
 16
16 -
 17
17 -
18
-
19
-
20
-
21
-
22
-
23
-
24
-
25
-
26
-
27
-
28
-
29
-
30
-
31
-
32
-
33
-
34
-
35
-
36
-
37
-
38
-
39
-
40
-
41
-
42
-
43
-
44
-
45
-
46
-
47
-
48
-
49
-
50
-
51
-
52
-
53
-
54
-
55
-
56
-
57
-
58
-
59
-
60
-
61
-
62
-
63
-
64
-
65
-
66
-
67
-
68
-
69
-
70
-
71
-
72
-
73
-
74
-
75
-
76
-
77
-
78
-
79
-
80
-
81
-
82
-
83
-
84
-
85
-
86
-
87
-
88
-
89
-
90
-
91
-
92
-
93
-
94
-
95
-
96
-
97
-
98
-
99
-
100
-
101
-
102
-
103
-
104
-
105
-
106
-
107
-
108
-
109
-
110
-
111
-
112
-
113
-
114
-
115
-
116
-
117
-
118
-
119
-
120
-
121
-
122
-
123
-
124
-
125
-
126
-
127
-
128
-
129
-
130
-
131
-
132
 |
 |

4 Innovating Toward Faster Growth
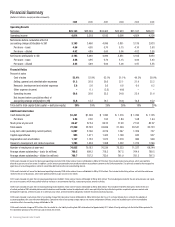
Financial Summary
(Dollars in millions, except per share amounts)
2009 2008 2007 2006 2005 2004
Operating Results
Net sales $23,123 $25,269 $24,462 $22,923 $21,167 $20,011
Operating income 4,814 5,218 6,193 5,696 4,854 4,326
Net income before cumulative effect of
accounting change attributable to 3M 3,193 3,460 4,096 3,851 3,139 2,833
Per share – basic 4.56 4.95 5.70 5.15 4.10 3.63
Per share – diluted 4.52 4.89 5.60 5.06 4.02 3.55
Net income attributable to 3M 3,193 3,460 4,096 3,851 3,104 2,833
Per share – basic 4.56 4.95 5.70 5.15 4.06 3.63
Per share – diluted 4.52 4.89 5.60 5.06 3.97 3.55
Financial Ratios
Percent of sales
Cost of sales 52.4% 52.9% 52.1% 51.1% 49.2% 50.0%
Selling, general and administrative expenses 21.2 20.8 20.5 22.1 21.9 22.2
Research, development and related expenses 5.6 5.6 5.6 6.6 6.0 6.2
Other expense (income) – 0.1 (3.5) (4.6) – –
Operating income 20.8 20.6 25.3 24.8 22.9 21.6
Net income before cumulative effect of
accounting change attributable to 3M 13.8 13.7 16.7 16.8 14.8 14.2
Total debt to total capital (total capital = debt plus equity) 30% 39% 29% 26% 18% 20%
Additional Information
Cash dividends paid $1,431 $1,398 $ 1,380 $ 1,376 $ 1,286 $ 1,125
Per share 2.04 2.00 1.92 1.84 1.68 1.44
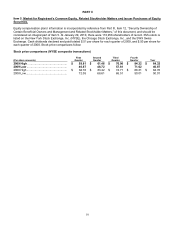
Stock price at year-end 82.67 57.54 84.32 77.93 77.50 82.07
Total assets 27,250 25,793 24,699 21,294 20,541 20,723
Long-term debt (excluding current portion) 5,097 5,166 4,019 1,047 1,309 727
Capital expenditures 903 1,471 1,422 1,168 943 937
Depreciation and amortization 1,157 1,153 1,072 1,079 986 999
Research, development and related expenses 1,293 1,404 1,368 1,522 1,274 1,246
Number of employees at year-end 74,835 79,183 76,239 75,333 71,227 68,244
Average shares outstanding – basic (in millions) 700.5 699.2 718.3 747.5 764.9 780.5
Average shares outstanding – diluted (in millions) 706.7 707.2 732.0 761.0 781.3 797.3
2009 results included net losses that decreased operating income by $194 million and net income attributable to 3M by $119 million. This included restructuring actions, which were partially
offset by a gain on sale of real estate. In addition, certain amounts presented for prior periods have been reclassified to conform to the 2009 presentation. This primarily related to the retrospective
application of accounting guidance related to convertible debt instruments and noncontrolling interest.
2008 results included net losses that decreased operating income by $269 million and net income attributable to 3M by $194 million. This included restructuring actions, exit activities and losses
related to the sale of businesses, which were partially offset by a gain on sale of real estate.
2007 results included net gains that increased operating income by $681 million and net income attributable to 3M by $448 million. This included gains related to the sale of businesses and a gain
on sale of real estate, which were partially offset by increases in environmental liabilities, restructuring actions and exit activities.
2006 results included net gains that increased operating income by $523 million and net income attributable to 3M by $438 million. This included net benefits from gains related to the sale
of certain portions of 3M’s branded pharmaceuticals business and favorable income tax adjustments, which were partially offset by restructuring actions, acquired in-process research and
development expenses, settlement costs of an antitrust class action, and environmental obligations related to the pharmaceuticals business.
2005 results included a cumulative effect of accounting change that reduced net income attributable to 3M by $35 million after tax, or 5 cents per diluted share, related to the adoption of
accounting guidance for asset retirement obligations. Cumulative effect of accounting change impacts net income attributable to 3M only, and is not included as part of net income before
cumulative effect of accounting change attributable to 3M.
2005 results included charges of $75 million after tax related to a tax liability resulting from 3M’s reinvestment of approximately $1.7 billion of foreign earnings into the United States pursuant to
the repatriation provision of the American Jobs Creation Act of 2004.