3M 2009 Annual Report Download - page 105
Download and view the complete annual report
Please find page 105 of the 2009 3M annual report below. You can navigate through the pages in the report by either clicking on the pages listed below, or by using the keyword search tool below to find specific information within the annual report.-
 1
1 -
2
-
3
-
4
-
5
-
6
-
7
-
8
-
9
-
10
-
11
-
12
-
13
-
14
-
15
-
16
-
17
-
18
-
19
-
20
-
21
-
22
-
23
-
24
-
25
-
26
-
27
-
28
-
29
-
30
-
31
-
32
-
33
-
34
-
35
-
36
-
37
-
38
-
39
-
40
-
41
-
42
-
43
-
44
-
45
-
46
-
47
-
48
-
49
-
50
-
51
-
52
-
53
-
54
-
55
-
56
-
57
-
58
-
59
-
60
-
61
-
62
-
63
-
64
-
65
-
66
-
67
-
68
-
69
-
70
-
71
-
72
-
73
-
74
-
75
-
76
-
77
-
78
-
79
-
80
-
81
-
82
-
83
-
84
-
85
-
86
-
87
-
88
-
89
-
90
-
91
-
92
-
93
-
94
-
 95
95 -
 96
96 -
 97
97 -
 98
98 -
 99
99 -
 100
100 -
 101
101 -
 102
102 -
 103
103 -
 104
104 -
 105
105 -
 106
106 -
 107
107 -
 108
108 -
 109
109 -
 110
110 -
 111
111 -
 112
112 -
 113
113 -
 114
114 -
 115
115 -
116
-
117
-
118
-
119
-
120
-
121
-
122
-
123
-
124
-
125
-
126
-
127
-
128
-
129
-
130
-
131
-
132
 |
 |

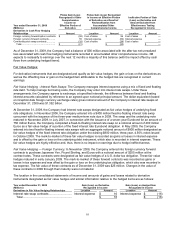
99
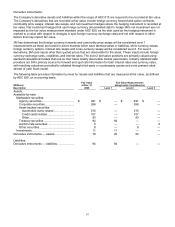
asset grouping’s carrying amount exceeded the remaining expected cash flows. As a result, associated assets were
written down to a fair value of $41 million in June 2009. 3M primarily uses a discounted cash flow model that uses
inputs other than quoted prices that are observable, such as interest rates and cost of capital, to determine the fair
value of such assets. 3M considers these level 2 inputs. Refer to Note 1 (“Property, plant and equipment” and
“Intangible Assets”) for further discussion of accounting policies related to long-lived asset impairments.
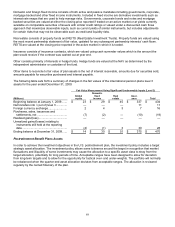
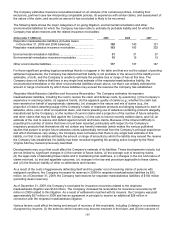
The following table provides information by level for nonfinancial assets and liabilities that were measured at fair
value during 2009, as defined by ASC 820, on a nonrecurring basis.
Twelve months ended December 31, 2009 Fair Value Measurements Using
Quoted Prices
Fair value in Active Significant
Twelve Markets Other Significant
months for Observable Unobservable
(Millions) ended Identical Assets Inputs Inputs Total Gains
Description Dec. 31, 2009 (Level 1) (Level 2) (Level 3) (Losses)
Long-lived assets held and used............. $ 41 $ — $ 41 $ — $ (32)
Business combinations ........................... 50 — 50 — —
Total ........................................................ $ (32)
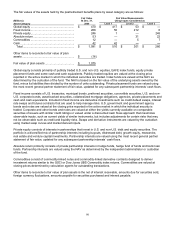
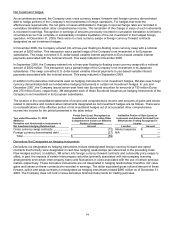
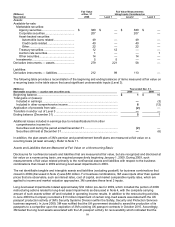
Fair value of financial instruments: At December 31, 2009 and 2008, the Company’s financial instruments included
cash and cash equivalents, marketable securities, accounts receivable, investments, accounts payable, borrowings,
and derivative contracts. The fair values of cash and cash equivalents, accounts receivable, accounts payable, and
short-term borrowings and current portion of long-term debt (except the $350 million Dealer Remarketable Securities
prior to 2009) approximated carrying values because of the short-term nature of these instruments. Available-for-sale
marketable securities and investments, in addition to certain derivative instruments, are recorded at fair values as
indicated in the preceding disclosures. Fair values for investments held at cost are not readily available, but are
estimated to approximate fair value. The Company utilized third-party quotes to estimate fair values for its Dealer
Remarketable Securities and long-term debt. Information with respect to the carrying amounts and estimated fair
values of these financial instruments follow:
2009 2008
(Millions)
Carrying
Amount
Fair
Value
Carrying
Amount
Fair
Value
Dealer Remarketable Securities ......................... $ 350 $ 350 $ 350 $ 364
Long-term debt .................................................... 5,097 5,355 5,166 5,375
The fair values reflected above consider the terms of the related debt absent the impacts of derivative/hedging
activity. The carrying amount of long-term debt referenced above is impacted by certain fixed-to-floating interest rate
swaps that are designated as fair value hedges and by the designation of 1,025 million Euros of fixed rate Eurobond
securities issued by the Company as hedging instruments of the Company’s net investment in its European
subsidiaries. 3M’s fixed-rate bonds are trading at a premium at December 31, 2009 due to the low market interest
rates and tightening of 3M’s credit spreads during 2009.