3M 2009 Annual Report Download - page 16
Download and view the complete annual report
Please find page 16 of the 2009 3M annual report below. You can navigate through the pages in the report by either clicking on the pages listed below, or by using the keyword search tool below to find specific information within the annual report.-
 1
1 -
2
-
3
-
4
-
5
-
 6
6 -
 7
7 -
 8
8 -
 9
9 -
 10
10 -
 11
11 -
 12
12 -
 13
13 -
 14
14 -
 15
15 -
 16
16 -
 17
17 -
 18
18 -
 19
19 -
 20
20 -
 21
21 -
 22
22 -
 23
23 -
 24
24 -
 25
25 -
 26
26 -
27
-
28
-
29
-
30
-
31
-
32
-
33
-
34
-
35
-
36
-
37
-
38
-
39
-
40
-
41
-
42
-
43
-
44
-
45
-
46
-
47
-
48
-
49
-
50
-
51
-
52
-
53
-
54
-
55
-
56
-
57
-
58
-
59
-
60
-
61
-
62
-
63
-
64
-
65
-
66
-
67
-
68
-
69
-
70
-
71
-
72
-
73
-
74
-
75
-
76
-
77
-
78
-
79
-
80
-
81
-
82
-
83
-
84
-
85
-
86
-
87
-
88
-
89
-
90
-
91
-
92
-
93
-
94
-
95
-
96
-
97
-
98
-
99
-
100
-
101
-
102
-
103
-
104
-
105
-
106
-
107
-
108
-
109
-
110
-
111
-
112
-
113
-
114
-
115
-
116
-
117
-
118
-
119
-
120
-
121
-
122
-
123
-
124
-
125
-
126
-
127
-
128
-
129
-
130
-
131
-
132
 |
 |

10
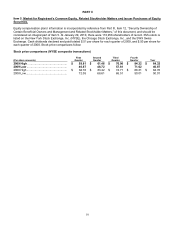
PART II
Item 5. Market for Registrant’s Common Equity, Related Stockholder Matters and Issuer Purchases of Equity
Securities.
Equity compensation plans’ information is incorporated by reference from Part III, Item 12, “Security Ownership of
Certain Beneficial Owners and Management and Related Stockholder Matters,” of this document, and should be
considered an integral part of Item 5. At January 29, 2010, there were 110,956 shareholders of record. 3M’s stock is
listed on the New York Stock Exchange, Inc. (NYSE), the Chicago Stock Exchange, Inc., and the SWX Swiss
Exchange. Cash dividends declared and paid totaled $.51 per share for each quarter of 2009, and $.50 per share for
each quarter of 2008. Stock price comparisons follow:
Stock price comparisons (NYSE composite transactions)
(Per share amounts)
First
Quarter
Second
Quarter
Third
Quarter
Fourth
Quarter Year
2009 High .................................................. $ 59.81 $ 61.46 $ 76.00 $ 84.32 $ 84.32
2009 Low ................................................... 40.87 48.72 57.81 71.62 40.87
2008 High ................................................... $ 84.76 $ 83.22 $ 74.71 $ 68.31 $ 84.76
2008 Low.................................................... 72.05 68.61 65.51 50.01 50.01