3M 2009 Annual Report Download - page 53
Download and view the complete annual report
Please find page 53 of the 2009 3M annual report below. You can navigate through the pages in the report by either clicking on the pages listed below, or by using the keyword search tool below to find specific information within the annual report.-
 1
1 -
2
-
3
-
4
-
5
-
6
-
7
-
8
-
9
-
10
-
11
-
12
-
13
-
14
-
15
-
16
-
17
-
18
-
19
-
20
-
21
-
22
-
23
-
24
-
25
-
26
-
27
-
28
-
29
-
30
-
31
-
32
-
33
-
34
-
35
-
36
-
37
-
38
-
39
-
40
-
41
-
42
-
 43
43 -
 44
44 -
 45
45 -
 46
46 -
 47
47 -
 48
48 -
 49
49 -
 50
50 -
 51
51 -
 52
52 -
 53
53 -
 54
54 -
 55
55 -
 56
56 -
 57
57 -
 58
58 -
 59
59 -
 60
60 -
 61
61 -
 62
62 -
 63
63 -
64
-
65
-
66
-
67
-
68
-
69
-
70
-
71
-
72
-
73
-
74
-
75
-
76
-
77
-
78
-
79
-
80
-
81
-
82
-
83
-
84
-
85
-
86
-
87
-
88
-
89
-
90
-
91
-
92
-
93
-
94
-
95
-
96
-
97
-
98
-
99
-
100
-
101
-
102
-
103
-
104
-
105
-
106
-
107
-
108
-
109
-
110
-
111
-
112
-
113
-
114
-
115
-
116
-
117
-
118
-
119
-
120
-
121
-
122
-
123
-
124
-
125
-
126
-
127
-
128
-
129
-
130
-
131
-
132
 |
 |

47
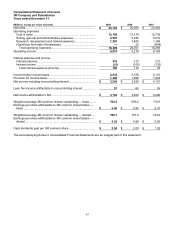
Consolidated Statement of Income
3M Company and Subsidiaries
Years ended December 31
(Millions, except per share amounts) 2009 2008 2007
Net sales ........................................................................................ $ 23,123 $ 25,269 $ 24,462
Operating expenses
Cost of sales ............................................................................... 12,109 13,379 12,735
Selling, general and administrative expenses ............................ 4,907 5,245 5,015
Research, development and related expenses .......................... 1,293 1,404 1,368
(Gain)/loss from sale of businesses ...........................................
—
23 (849)
Total operating expenses........................................................ 18,309 20,051 18,269
Operating income........................................................................... 4,814 5,218 6,193
Interest expense and income
Interest expense ......................................................................... 219 215 210
Interest income ........................................................................... (37) (105) (132)
Total interest expense (income).............................................. 182 110 78
Income before income taxes .......................................................... 4,632 5,108 6,115
Provision for income taxes ............................................................. 1,388 1,588 1,964
Net income including noncontrolling interest ................................. $ 3,244 $ 3,520 $ 4,151
Less: Net income attributable to noncontrolling interest ................ 51 60 55
Net income attributable to 3M ........................................................ $ 3,193 $ 3,460 $ 4,096
Weighted average 3M common shares outstanding — basic ....... 700.5 699.2 718.3
Earnings per share attributable to 3M common shareholders —
basic ........................................................................................... $4.56
$ 4.95 $ 5.70
Weighted average 3M common shares outstanding — diluted ..... 706.7 707.2 732.0
Earnings per share attributable to 3M common shareholders —
diluted ......................................................................................... $4.52
$ 4.89 $ 5.60
Cash dividends paid per 3M common share.................................. $2.04
$ 2.00 $ 1.92
The accompanying Notes to Consolidated Financial Statements are an integral part of this statement.