3M 2009 Annual Report Download - page 123
Download and view the complete annual report
Please find page 123 of the 2009 3M annual report below. You can navigate through the pages in the report by either clicking on the pages listed below, or by using the keyword search tool below to find specific information within the annual report.-
 1
1 -
2
-
3
-
4
-
5
-
6
-
7
-
8
-
9
-
10
-
11
-
12
-
13
-
14
-
15
-
16
-
17
-
18
-
19
-
20
-
21
-
22
-
23
-
24
-
25
-
26
-
27
-
28
-
29
-
30
-
31
-
32
-
33
-
34
-
35
-
36
-
37
-
38
-
39
-
40
-
41
-
42
-
43
-
44
-
45
-
46
-
47
-
48
-
49
-
50
-
51
-
52
-
53
-
54
-
55
-
56
-
57
-
58
-
59
-
60
-
61
-
62
-
63
-
64
-
65
-
66
-
67
-
68
-
69
-
70
-
71
-
72
-
73
-
74
-
75
-
76
-
77
-
78
-
79
-
80
-
81
-
82
-
83
-
84
-
85
-
86
-
87
-
88
-
89
-
90
-
91
-
92
-
93
-
94
-
95
-
96
-
97
-
98
-
99
-
100
-
101
-
102
-
103
-
104
-
105
-
106
-
107
-
108
-
109
-
110
-
111
-
112
-
 113
113 -
 114
114 -
 115
115 -
 116
116 -
 117
117 -
 118
118 -
 119
119 -
 120
120 -
 121
121 -
 122
122 -
 123
123 -
 124
124 -
 125
125 -
 126
126 -
 127
127 -
 128
128 -
 129
129 -
 130
130 -
 131
131 -
 132
132
 |
 |

117
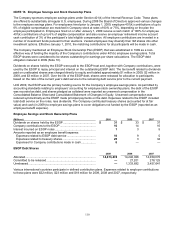
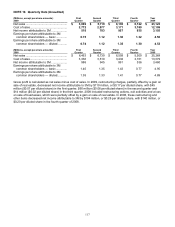
NOTE 19. Quarterly Data (Unaudited)
(Millions, except per-share amounts)
2009
First
Quarter
Second
Quarter
Third
Quarter
Fourth
Quarter
Year
2009
Net sales ....................................................
$ 5,089 $ 5,719 $ 6,193 $ 6,122 $ 23,123
Cost of sales...............................................
2,772 2,977 3,171 3,189 12,109
Net income attributable to 3M ....................
518 783 957 935 3,193
Earnings per share attributable to 3M
common shareholders — basic..............
0.75 1.12 1.36 1.32 4.56
Earnings per share attributable to 3M
common shareholders — diluted............
0.74 1.12 1.35 1.30 4.52
(Millions, except per-share amounts)
2008
First
Quarter
Second
Quarter
Third
Quarter
Fourth
Quarter
Year
2008
Net sales .................................................... $ 6,463 $ 6,739 $ 6,558
.$ 5,509 $ 25,269
Cost of sales............................................... 3,336 3,510 3,432 3,101 13,379
Net income attributable to 3M .................... 988 945 991 536 3,460
Earnings per share attributable to 3M
common shareholders — basic.............. 1.40 1.35 1.43 0.77 4.95
Earnings per share attributable to 3M
common shareholders — diluted............
1.38 1.33 1.41 0.77 4.89
Gross profit is calculated as net sales minus cost of sales. In 2009, restructuring charges, partially offset by a gain on
sale of real estate, decreased net income attributable to 3M by $119 million, or $0.17 per diluted share, with $45
million ($0.07 per diluted share) in the first quarter, $60 million ($0.08 per diluted share) in the second quarter and
$14 million ($0.02 per diluted share) in the third quarter. 2008 included restructuring actions, exit activities and a loss
on sale of businesses, which were partially offset by a gain on sale of real estate. In 2008, these restructuring and
other items decreased net income attributable to 3M by $194 million, or $0.28 per diluted share, with $140 million, or
$0.20 per diluted share in the fourth quarter of 2008.
.