TomTom 2009 Annual Report Download - page 84
Download and view the complete annual report
Please find page 84 of the 2009 TomTom annual report below. You can navigate through the pages in the report by either clicking on the pages listed below, or by using the keyword search tool below to find specific information within the annual report.-
 1
1 -
2
-
3
-
4
-
5
-
6
-
7
-
8
-
9
-
10
-
11
-
12
-
13
-
14
-
15
-
16
-
17
-
18
-
19
-
20
-
21
-
22
-
23
-
24
-
25
-
26
-
27
-
28
-
29
-
30
-
31
-
32
-
33
-
34
-
35
-
36
-
37
-
38
-
39
-
40
-
41
-
42
-
43
-
44
-
45
-
46
-
47
-
48
-
49
-
50
-
51
-
52
-
53
-
54
-
55
-
56
-
57
-
58
-
59
-
60
-
61
-
62
-
63
-
64
-
65
-
66
-
67
-
68
-
69
-
70
-
71
-
72
-
73
-
 74
74 -
 75
75 -
 76
76 -
 77
77 -
 78
78 -
 79
79 -
 80
80 -
 81
81 -
 82
82 -
 83
83 -
 84
84 -
 85
85 -
 86
86 -
 87
87 -
 88
88 -
 89
89 -
 90
90 -
 91
91 -
 92
92 -
 93
93 -
 94
94 -
95
-
96
-
97
-
98
-
99
-
100
 |
 |

82 / NOTES TO THE CONSOLIDATED FINANCIAL STATEMENTS
OF TOMTOM NV
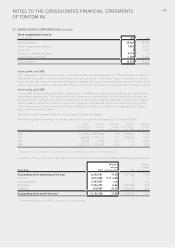
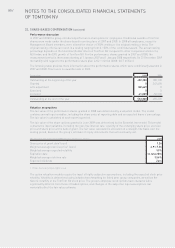
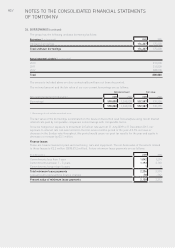
24. BORROWINGS (continued)
The group has the following undrawn borrowing facilities:
Borrowings (€ in thousands) 2009 2008
Undrawn borrowings 174,227 175,000
Total undrawn borrowings 174,227 175,000
Annual repayment schedule (€ in thousands)
2010 210,000
2011 210,000
2012 388,000
Total 808,000
The amounts included above are due contractually and have not been discounted.
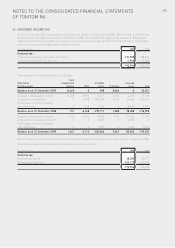
The notional amount and the fair value of our non-current borrowings are as follows:
Notional amount Fair value
Non-current borrowings (€ in thousands) 2009 2008 2009 2008
Borrowings1598,000 1,268,000 552,587 930,355
598,000 1,268,000 552,587 930,355
1 Borrowings do not include amortised costs.
The fair value of the borrowings is estimated on the basis of discounted cash flow analysis using recent market
interest rate paid by comparable companies on borrowings with comparable terms.
Since we hedged our exposure to movement in Euribor rate as from 31 July 2009 to 31 December 2011, our
exposure to interest rate risk was limited to the first seven months period of the year. A 0.5% increase or
decrease in the Euribor rate throughout this period would cause our post tax results for the year and equity to
decrease or increase by €3.1 million.
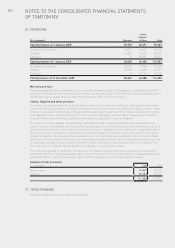
Finance leases
These are finance leases for plant and machinery, cars and equipment. The net book value of the assets related
to these leases is €2.2 million (2008:€3.2 million). Future minimum lease payments are as follows:
(€ in thousands) 2009 2008
Commitments less than 1 year 1,042 1,214
Commitments between 1 – 5 years 1,193 2,160
Commitments longer than 5 years 10
Total minimum lease payments 2,236 3,374
Less amounts representing finance charges -78 -162
Present value of minimum lease payments 2,158 3,212