TomTom 2009 Annual Report Download - page 76
Download and view the complete annual report
Please find page 76 of the 2009 TomTom annual report below. You can navigate through the pages in the report by either clicking on the pages listed below, or by using the keyword search tool below to find specific information within the annual report.-
 1
1 -
2
-
3
-
4
-
5
-
6
-
7
-
8
-
9
-
10
-
11
-
12
-
13
-
14
-
15
-
16
-
17
-
18
-
19
-
20
-
21
-
22
-
23
-
24
-
25
-
26
-
27
-
28
-
29
-
30
-
31
-
32
-
33
-
34
-
35
-
36
-
37
-
38
-
39
-
40
-
41
-
42
-
43
-
44
-
45
-
46
-
47
-
48
-
49
-
50
-
51
-
52
-
53
-
54
-
55
-
56
-
57
-
58
-
59
-
60
-
61
-
62
-
63
-
64
-
65
-
 66
66 -
 67
67 -
 68
68 -
 69
69 -
 70
70 -
 71
71 -
 72
72 -
 73
73 -
 74
74 -
 75
75 -
 76
76 -
 77
77 -
 78
78 -
 79
79 -
 80
80 -
 81
81 -
 82
82 -
 83
83 -
 84
84 -
 85
85 -
 86
86 -
87
-
88
-
89
-
90
-
91
-
92
-
93
-
94
-
95
-
96
-
97
-
98
-
99
-
100
 |
 |

74 / NOTES TO THE CONSOLIDATED FINANCIAL STATEMENTS
OF TOMTOM NV
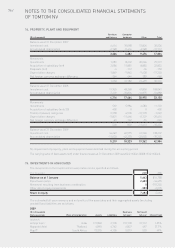
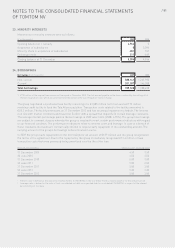
14. PROPERTY, PLANT AND EQUIPMENT
Furniture Computer
(€ in thousands) and fixtures hardware Other Total
Balance as at 31 December 2007
Investment cost 6,614 10,098 13,824 30,536
Accumulated depreciation -2,948 -5,416 -4,348 -12,712
3,666 4,682 9,476 17,824
Movements
Investments 1,081 8,232 20,006 29,319
Acquisition of subsidiary (net) 2,086 11,881 8,885 22,852
Disposals (net) -4 -112 -34 -150
Depreciation charges -1,849 -7,863 -7,638 -17,350
Net foreign currency exchange difference -264 644 280 660
1,050 12,782 21,499 35,331
Balance as at 31 December 2008
Investment cost 11,925 48,268 47,850 108,043
Accumulated depreciation -7,209 -30,804 -16,875 -54,888
4,716 17,464 30,975 53,155
Movements
Investments 569 5,984 4,580 11,133
Acquisition of subsidiary (note 30) 402 00402
Transfer between categories 3,398 6,503 -10,970 -1,069
Depreciation charges -3,821 -11,466 -5,129 -20,416
Net foreign currency exchange difference -45 -162 -94 -301
503 859 -11,613 -10,251
Balance as at 31 December 2009
Investment cost 16,249 60,593 41,365 118,207
Accumulated depreciation -11,030 -42,270 -22,003 -75,303
5,219 18,323 19,362 42,904
No impairment of property, plant and equipment was identified during the accounting period.
The carrying value of fixed assets held under finance leases at 31 December 2009 was €2.2 million (2008: €3.2 million).
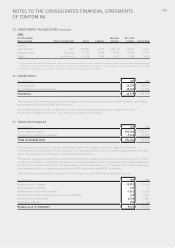
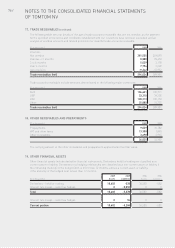
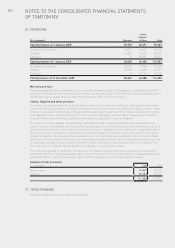
15. INVESTMENTS IN ASSOCIATES
The movements in the investments in associates can be specified as follows:
(€ in thousands) 2009 2008
Balance as at 1 January 5,663 816,788
Result associates 2,603 -16,695
Movement resulting from business combination 0-792,355
Other direct equity movements -583 -2,075
Share in equity 7,683 5,663
The estimated full year revenues and net profits of the associates and their aggregated assets (excluding
goodwill) and liabilities are as follows:
2009
(€ in thousands) Revenues Net result
Name associate Place of incorporation Assets Liabilities full year2full year Interest held
Infotech
enterprises1,2 India 117,860 2,905 131,918 13,712 1.35%
Mappoint Asia1Thailand 4,890 4,762 6,827 497 27.7%
MapIT1South Africa 13,075 4,105 5,019 503 49%