TomTom 2009 Annual Report Download - page 72
Download and view the complete annual report
Please find page 72 of the 2009 TomTom annual report below. You can navigate through the pages in the report by either clicking on the pages listed below, or by using the keyword search tool below to find specific information within the annual report.-
 1
1 -
2
-
3
-
4
-
5
-
6
-
7
-
8
-
9
-
10
-
11
-
12
-
13
-
14
-
15
-
16
-
17
-
18
-
19
-
20
-
21
-
22
-
23
-
24
-
25
-
26
-
27
-
28
-
29
-
30
-
31
-
32
-
33
-
34
-
35
-
36
-
37
-
38
-
39
-
40
-
41
-
42
-
43
-
44
-
45
-
46
-
47
-
48
-
49
-
50
-
51
-
52
-
53
-
54
-
55
-
56
-
57
-
58
-
59
-
60
-
61
-
 62
62 -
 63
63 -
 64
64 -
 65
65 -
 66
66 -
 67
67 -
 68
68 -
 69
69 -
 70
70 -
 71
71 -
 72
72 -
 73
73 -
 74
74 -
 75
75 -
 76
76 -
 77
77 -
 78
78 -
 79
79 -
 80
80 -
 81
81 -
 82
82 -
83
-
84
-
85
-
86
-
87
-
88
-
89
-
90
-
91
-
92
-
93
-
94
-
95
-
96
-
97
-
98
-
99
-
100
 |
 |

70 / NOTES TO THE CONSOLIDATED FINANCIAL STATEMENTS
OF TOMTOM NV
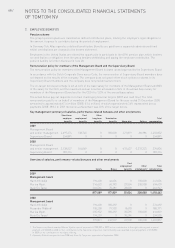
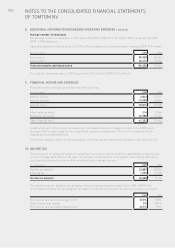
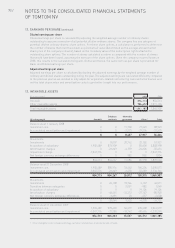
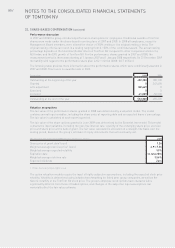
8. ADDITIONAL INFORMATION REGARDING OPERATING EXPENSES (continued)
Average number of employees
The average number of employees in 2009 was 3,294 (2008: 2,703). At 31 December 2009, the group had 3,089
(2008: 3,498) employees.
Operating expenses include an amount of €106 million for depreciation and amortisation expenses (2008: €73 million).
(€ in thousands) 2009 2008
Amortisation 85,920 55,414
Depreciation 20,416 17,350
Total amortisation and depreciation 106,336 72,764
The costs for operating leases in 2009 amounted to €14.1 million (2008: €17.4 million).
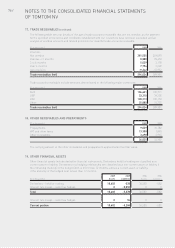
9. FINANCIAL INCOME AND EXPENSES
Financial income and expenses include the following items:
(€ in thousands) 2009 2008
Interest income 2,843 13,991
Interest expense -73,658 -66,046
Interest result -70,815 -52,055
Other financial result -214 -3,966
Exchange rate result -40,988 76,114
Other financial result -41,202 72,148
A substantial part of the foreign exchange result is related to results on hedge contracts to sell GBP and to
purchase USD in order to pay our most significant contract manufacturers. This result is made up of both
realised and unrealised amounts.
The interest expense relates to interest paid on our borrowings and amortised transaction costs (see note 24).
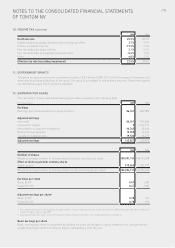
10. INCOME TAX
The activities of the group are subject to corporate income tax in several countries, depending on presence and
activity. The applicable statutory tax rates vary between 12.5% and 41%. This, together with timing differences,
can cause the effective tax rate to differ from the Dutch corporate tax rate.
(€ in thousands) 2009 2008
Current tax expense 23,809 60,832
Deferred tax 1,279 17,298
Income tax expense 25,088 78,130
The effective tax rate, based on income before taxes excluding impairment was 22.5% (2008: 30.8%). The
reconciliation between the tax charge on the basis of the Dutch tax rate and the effective tax rate is as follows:
2009 2008
Effective tax rate (excluding impairment) 22.5% 30.8%
Effect impairment charge 0% -40.6%
Effective tax rate (including impairment) 22.5% -9.8%