TomTom 2009 Annual Report Download - page 77
Download and view the complete annual report
Please find page 77 of the 2009 TomTom annual report below. You can navigate through the pages in the report by either clicking on the pages listed below, or by using the keyword search tool below to find specific information within the annual report.-
 1
1 -
2
-
3
-
4
-
5
-
6
-
7
-
8
-
9
-
10
-
11
-
12
-
13
-
14
-
15
-
16
-
17
-
18
-
19
-
20
-
21
-
22
-
23
-
24
-
25
-
26
-
27
-
28
-
29
-
30
-
31
-
32
-
33
-
34
-
35
-
36
-
37
-
38
-
39
-
40
-
41
-
42
-
43
-
44
-
45
-
46
-
47
-
48
-
49
-
50
-
51
-
52
-
53
-
54
-
55
-
56
-
57
-
58
-
59
-
60
-
61
-
62
-
63
-
64
-
65
-
66
-
 67
67 -
 68
68 -
 69
69 -
 70
70 -
 71
71 -
 72
72 -
 73
73 -
 74
74 -
 75
75 -
 76
76 -
 77
77 -
 78
78 -
 79
79 -
 80
80 -
 81
81 -
 82
82 -
 83
83 -
 84
84 -
 85
85 -
 86
86 -
 87
87 -
88
-
89
-
90
-
91
-
92
-
93
-
94
-
95
-
96
-
97
-
98
-
99
-
100
 |
 |

/ 75
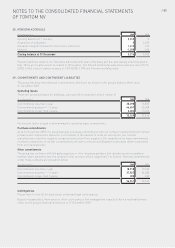
NOTES TO THE CONSOLIDATED FINANCIAL STATEMENTS
OF TOMTOM NV
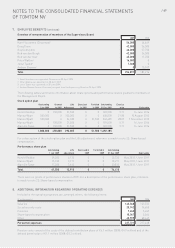
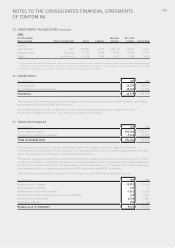
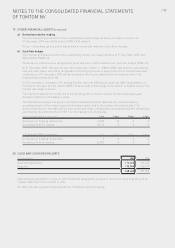
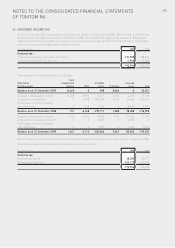
15. INVESTMENTS IN ASSOCIATES (continued)
2008
(€ in thousands) Revenues Net result
Name associate Place of incorporation Assets Liabilities full year2full year Interest held
Infotech
enterprises1,2 India 105,780 6,272 106,113 13,470 1.36%
Mappoint Asia1Thailand 5,170 5,560 3,929 -1,553 27.7%
MapIT1South Africa 11,744 3,649 5,361 1,068 49%
1 All associates have a 31 March year-end, data for calculating the result associate, based on the equity method, is obtained from January through
to December. The summarised financial information of Infotech presented above is based on financial statements for the year ended 31 March 2009.
2 Infotech is regarded as an associate as Tele Atlas is represented in the Supervisory Board.
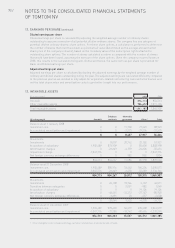
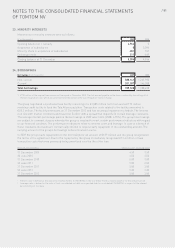
16. INVENTORIES
(€ in thousands) 2009 2008
Finished goods 46,370 87,746
Components and sub-assemblies 20,349 57,652
Inventories 66,719 145,398
The amount of inventories recognised as an expense when the inventories are sold and included in cost of sales
amounted to €506 million (2008: €667 million).
As a result of the write-down of inventories to their net realisable value, the group recognised a cost of
€14.5 million (2008: €6.6 million). The costs are included in cost of sales.
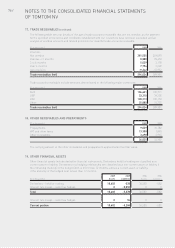
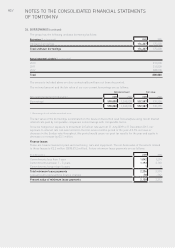
17. TRADE RECEIVABLES
(€ in thousands) 2009 2008
Gross trade receivables 303,266 303,933
Allowance for doubtful receivables -9,242 -13,952
Trade receivables (net) 294,024 289,981
All receivables are expected to be recovered within a year. An allowance has been made for estimated
unrecoverable amounts from the sale of goods. The carrying amount of trade receivables approximates their fair
value. The group does not hold any collateral over these balances.
The group’s exposure to credit risk is influenced mainly by the individual characteristics of each customer. There
is some concentration of credit risk with respect to trade receivables, but this is actively monitored by management.
Credit risk is to some extent further mitigated by the purchase of insurance for European, North American, Asian,
Australian and African receivables balances from PND, Automotive and WORK customers.
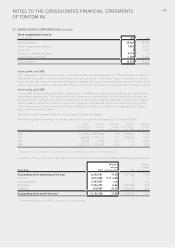
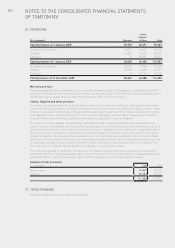
The following summarises the movement in the allowance for doubtful trade receivables account:
(€ in thousands) 2009 2008
Balance as at 1 January -13,952 -3,042
Acquisition of subsidiary -435 0
Additional receivables impairment -1,622 -13,595
Receivables written off during the year as uncollectible 145 1,847
Unused amounts reversed 6,330 881
Translation effects 292 -43
Balance as at 31 December -9,242 -13,952