TomTom 2009 Annual Report Download - page 74
Download and view the complete annual report
Please find page 74 of the 2009 TomTom annual report below. You can navigate through the pages in the report by either clicking on the pages listed below, or by using the keyword search tool below to find specific information within the annual report.-
 1
1 -
2
-
3
-
4
-
5
-
6
-
7
-
8
-
9
-
10
-
11
-
12
-
13
-
14
-
15
-
16
-
17
-
18
-
19
-
20
-
21
-
22
-
23
-
24
-
25
-
26
-
27
-
28
-
29
-
30
-
31
-
32
-
33
-
34
-
35
-
36
-
37
-
38
-
39
-
40
-
41
-
42
-
43
-
44
-
45
-
46
-
47
-
48
-
49
-
50
-
51
-
52
-
53
-
54
-
55
-
56
-
57
-
58
-
59
-
60
-
61
-
62
-
63
-
 64
64 -
 65
65 -
 66
66 -
 67
67 -
 68
68 -
 69
69 -
 70
70 -
 71
71 -
 72
72 -
 73
73 -
 74
74 -
 75
75 -
 76
76 -
 77
77 -
 78
78 -
 79
79 -
 80
80 -
 81
81 -
 82
82 -
 83
83 -
 84
84 -
85
-
86
-
87
-
88
-
89
-
90
-
91
-
92
-
93
-
94
-
95
-
96
-
97
-
98
-
99
-
100
 |
 |

72 / NOTES TO THE CONSOLIDATED FINANCIAL STATEMENTS
OF TOMTOM NV
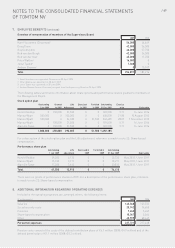
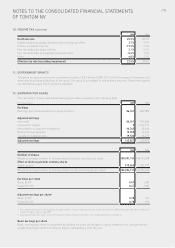
12. EARNINGS PER SHARE (continued)
Diluted earnings per share
Diluted earnings per share is calculated by adjusting the weighted average number of ordinary shares
outstanding to assume conversion of all potential dilutive ordinary shares. The company has one category of
potential dilutive ordinary shares: share options. For these share options, a calculation is performed to determine
the number of shares that could have been acquired at fair value (determined as the average annual market
share price of the company’s shares), based on the monetary value of the subscription rights attached to
outstanding share options. The number of shares calculated as above is compared with the number of shares
that would have been issued, assuming the exercise of the share options. Given the company incurred losses in
2008, this results in the calculation being anti-dilutive and hence, the same net loss per share is presented for
Basic and Diluted earnings per share.
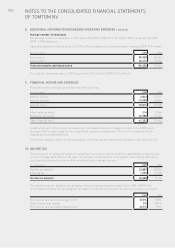
Adjusted earnings per share
Adjusted earnings per share is calculated by dividing the adjusted earnings by the weighted average number of
ordinary and diluted shares outstanding during the year. The adjusted earnings are calculated differently compared
to the previous year as we decided to only adjust for acquisition-related restructuring costs and amortisation and
not the total depreciation and amortisation costs to give better insight into our performance.
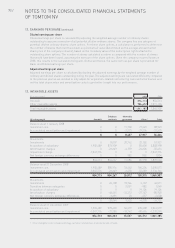
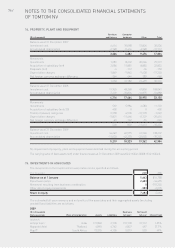
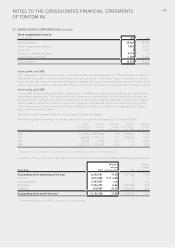
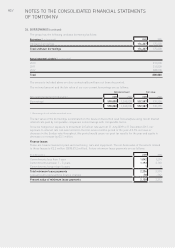
13. INTANGIBLE ASSETS
(€ in thousands) 2009 2008
Goodwill 854,713 854,713
Other intangible assets 986,472 1,011,194
Total intangible assets 1,841,185 1,865,907
Database Internally
(€ in thousands) Goodwill and tools generated Other1Total
Balance as at 1 January 2008
Investment cost 0011,700 77,223 88,923
Accumulated amortisation and impairment 00-3,273 -29,306 -32,579
008,427 47,917 56,344
Movements
Investments 0 8,007 20,762 23,152 51,921
Acquisition of subsidiary 1,902,489 872,909 0 83,600 2,858,998
Amortisation charges 0 -26,649 -4,159 -24,606 -55,414
Impairment charge -1,047,776 0 0 0 -1,047,776
Net foreign currency exchange differences 0 0 982 852 1,834
854,713 854,267 17,585 82,998 1,809,563
Balance as at 31 December 2008
Investment cost 1,902,489 880,916 32,462 184,204 3,000,071
Accumulated amortisation and impairment -1,047,776 -26,649 -6,450 -53,289 -1,134,164
854,713 854,267 26,012 130,915 1,865,907
Movements
Investments 0 20,108 19,766 3,137 43,011
Transfers between categories 002,051 -982 1,069
Acquisition of subsidiary 00019,126 19,126
Amortisation charges 0 -46,461 -12,312 -27,147 -85,920
Net foreign currency exchange differences 0 -1,691 20 -337 -2,008
0 -28,044 9,525 -6,203 -24,722
Balance as at 31 December 2009
Investment cost 1,902,489 899,603 54,279 205,208 3,061,579
Accumulated amortisation and impairment -1,047,776 -73,380 -18,742 -80,496 -1,220,394
854,713 826,223 35,537 124,712 1,841,185
1 Other intangible assets include technology, customer relationships, brand name and software.