TomTom 2009 Annual Report Download - page 20
Download and view the complete annual report
Please find page 20 of the 2009 TomTom annual report below. You can navigate through the pages in the report by either clicking on the pages listed below, or by using the keyword search tool below to find specific information within the annual report.-
 1
1 -
2
-
3
-
4
-
5
-
6
-
7
-
8
-
9
-
 10
10 -
 11
11 -
 12
12 -
 13
13 -
 14
14 -
 15
15 -
 16
16 -
 17
17 -
 18
18 -
 19
19 -
 20
20 -
 21
21 -
 22
22 -
 23
23 -
 24
24 -
 25
25 -
 26
26 -
 27
27 -
 28
28 -
 29
29 -
 30
30 -
31
-
32
-
33
-
34
-
35
-
36
-
37
-
38
-
39
-
40
-
41
-
42
-
43
-
44
-
45
-
46
-
47
-
48
-
49
-
50
-
51
-
52
-
53
-
54
-
55
-
56
-
57
-
58
-
59
-
60
-
61
-
62
-
63
-
64
-
65
-
66
-
67
-
68
-
69
-
70
-
71
-
72
-
73
-
74
-
75
-
76
-
77
-
78
-
79
-
80
-
81
-
82
-
83
-
84
-
85
-
86
-
87
-
88
-
89
-
90
-
91
-
92
-
93
-
94
-
95
-
96
-
97
-
98
-
99
-
100
 |
 |

0
200
100
400
300
500
600
700
2007
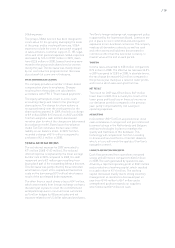
Stock compensation
2008 2009
Selling, general and
administrative expenses
Marketing expenses
Research & development expenses
Amortisation of technology
and databases
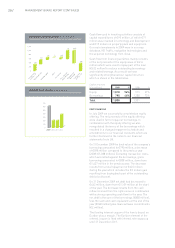
Europe
North America
Rest of world
70%
4%
26%
Europe
North America
Rest of world
68%
4%
28%
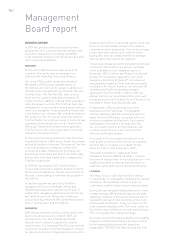
18 / MANAGEMENT BOARD REPORT (CONTINUED)
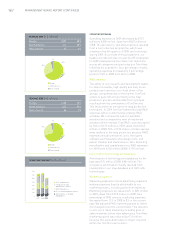
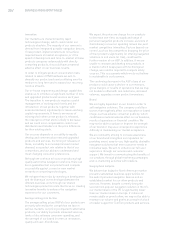
OPERATING EXPENSES
Operating expenses in 2009 decreased by €127
million to €500 million, down from €627 million in
2008. The decrease in operating expenses resulted
from a cost reduction programme, which was
initiated in the 4th quarter of 2008, and continued
during 2009. As a result of this programme, our
headcount reduced year-on-year by 409 employees
to 3,089 employees and we drove cost reductions
across all categories and particularly in Tele Atlas
following the acquisition. As a percentage of sales,
operating expenses decreased by 2 percentage
points to 34% in 2009 from 36% in 2008.
R&D expenses
The ability of our research and development teams
to create innovative, high-quality and easy to use
products and services is a critical driver of the
groups’ competitiveness in the market. TomTom
strives to gain efficiencies mainly in the map
production process and benefits from synergies
resulting from the combination of TomTom and
Tele Atlas and from innovation in map production
techniques. In 2009 TomTom lowered its total R&D
expenses without undermining strategic R&D
activities. We continued to invest in key R&D
activities and increased the level of investment
activities where needed. Total R&D costs decreased
by 16% to €139 million in 2009, down from €165
million in 2008. 76% or €20 million of these savings
were realised in the map production process. R&D
expenses include personnel costs, third party
software and manufacturing design costs, and
patent creation and maintenance costs. Excluding
amortisation and capitalisation our R&D expenses
for 2009 were €165 million (2008: €190 million).
Amortisation of technology and databases
Amortisation of technology and databases for the
year was €75 million (2008: €68 million). The
increase in amortisation mainly resulted from
investments in our map database and HD Traffic
technologies.
Marketing expenses
Marketing expenses include advertising expenses
and any expenses directly attributable to our
marketing teams, including personnel expenses.
Marketing expenses decreased 44% to €86 million
in 2009, down from €155 million in 2008. As a
percentage of PND revenue, marketing expenses
decreased from 11% in 2008 to 8% in the current
year. We adjusted PND marketing spend to reflect
the changed economic environment. This resulted
in a focus on trade marketing including point of
sales materials rather than advertising. Tele Atlas
marketing spend was reduced by €19 million
because this expenditure was no longer required
within the TomTom environment.
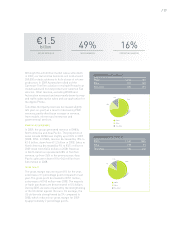
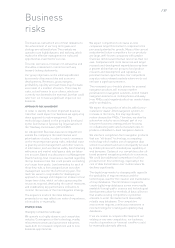
REVENUE 2009 (in € millions)
Europe 1,007 68%
North America 411 28%
Rest of world 62 4%
REVENUE 2008 (in € millions)
Europe 1,228 70%
North America 454 26%
Rest of world 66 4%
OPERATING EXPENSES (in € millions)