TCF Bank 2009 Annual Report Download - page 95
Download and view the complete annual report
Please find page 95 of the 2009 TCF Bank annual report below. You can navigate through the pages in the report by either clicking on the pages listed below, or by using the keyword search tool below to find specific information within the annual report.-
 1
1 -
2
-
3
-
4
-
5
-
6
-
7
-
8
-
9
-
10
-
11
-
12
-
13
-
14
-
15
-
16
-
17
-
18
-
19
-
20
-
21
-
22
-
23
-
24
-
25
-
26
-
27
-
28
-
29
-
30
-
31
-
32
-
33
-
34
-
35
-
36
-
37
-
38
-
39
-
40
-
41
-
42
-
43
-
44
-
45
-
46
-
47
-
48
-
49
-
50
-
51
-
52
-
53
-
54
-
55
-
56
-
57
-
58
-
59
-
60
-
61
-
62
-
63
-
64
-
65
-
66
-
67
-
68
-
69
-
70
-
71
-
72
-
73
-
74
-
75
-
76
-
77
-
78
-
79
-
80
-
81
-
82
-
83
-
84
-
 85
85 -
 86
86 -
 87
87 -
 88
88 -
 89
89 -
 90
90 -
 91
91 -
 92
92 -
 93
93 -
 94
94 -
 95
95 -
 96
96 -
 97
97 -
 98
98 -
 99
99 -
 100
100 -
 101
101 -
 102
102 -
 103
103 -
 104
104 -
 105
105 -
106
-
107
-
108
-
109
-
110
-
111
-
112
-
113
-
114
 |
 |

2009 Form 10-K : 79
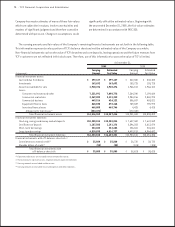
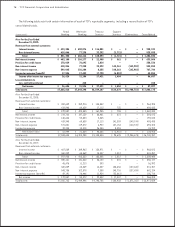
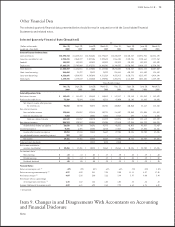
Other Financial Data
The selected quarterly nancial data presented below should be read in conjunction with the Consolidated Financial
Statements and related notes.
At
(Dollars in thousands, Sept. 30, June 30, March 31, Dec. 31, Sept. 30, June 30, March 31,
except per-share data) 2009 2009 2009 2008 2008 2008 2008
Loans and leases $14,329,264 $13,962,656 $13,795,617 $13,345,889 $13,105,237 $12,976,931 $12,826,194
Securities available for sale 2,060,227 2,087,406 2,098,628 1,966,104 2,102,756 2,120,664 2,177,262
Goodwill 152,599 152,599 152,599 152,599 152,599 152,599 152,599
Total assets 17,743,009 17,475,721 18,082,341 16,740,357 16,510,595 16,460,123 16,370,364
Total deposits 11,626,011 11,619,053 11,647,203 10,243,352 9,850,237 10,146,122 10,357,069
Short-term borrowings 21,397 25,829 26,299 226,861 603,233 411,802 138,442
Long-term borrowings 4,524,955 4,307,098 4,311,568 4,433,913 4,630,776 4,515,997 4,414,644
Total equity 1,179,839 1,142,535 1,499,956 1,493,776 1,111,029 1,088,301 1,129,870
Three Months Ended
Sept. 30, June 30, March 31, Dec. 31, Sept. 30, June 30, March 31,
2009 2009 2009 2008 2008 2008 2008
Net interest income $ 161,489 $ 156,463 $ 145,413 $ 147,117 $ 152,165 $ 151,562 $ 142,829
Provision for credit losses 75,544 61,891 43,712 47,050 52,105 62,895 29,995
Net interest income after provision
for credit losses 85,945 94,572 101,701 100,067 100,060 88,667 112,834
Non-interest income:
Fees and other revenue 128,057 129,814 102,731 116,807 123,045 121,504 121,013
Gains on securities, net – 10,556 11,548 8,167 498 1,115 6,286
Total non-interest income 128,057 140,370 114,279 124,974 123,543 122,619 127,299
Non-interest expense 190,267 196,546 174,208 179,810 177,588 168,729 168,276
Income before income tax expense 23,735 38,396 41,772 45,231 46,015 42,557 71,857
Income tax expense 6,491 14,853 15,125 17,527 15,889 18,855 24,431
Income after income tax expense 17,244 23,543 26,647 27,704 30,126 23,702 47,426
Loss attributable to non-controlling interest 207 – – – – – –
Net income 17,451 23,543 26,647 27,704 30,126 23,702 47,426
Preferred stock dividends – 13,218 5,185 2,540 – – –
Net income available to
common stockholders $ 17,451 $ 10,325 $ 21,462 $ 25,164 $ 30,126 $ 23,702 $ 47,426
Per common share:
Basic earnings $ .14 $ .08 $ .17 $ .20 $ .24 $ .19 $ .38
Diluted earnings $ .14 $ .08 $ .17 $ .20 $ .24 $ .19 $ .38
Dividends declared $ .05 $ .05 $ .25 $ .25 $ .25 $ .25 $ .25
Return on average assets (1) .39% .53% .62% .68% .73% .58% 1.18%
Return on average common equity (1) 6.03 3.61 7.58 9.00 11.11 8.57 17.08
Net interest margin (1) 3.92 3.80 3.66 3.84 3.97 4.00 3.84
Net charge-offs as a percentage
of average loans and leases (1) 1.52 1.43 1.04 1.02 .82 .83 .43
Average total equity to average assets 6.61 6.94 8.64 7.93 6.61 6.76 6.88
(1) Annualized.
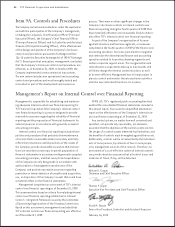
Item 9. Changes in and Disagreements With Accountants on Accounting
and Financial Disclosure
None.