TCF Bank 2009 Annual Report Download - page 40
Download and view the complete annual report
Please find page 40 of the 2009 TCF Bank annual report below. You can navigate through the pages in the report by either clicking on the pages listed below, or by using the keyword search tool below to find specific information within the annual report.-
 1
1 -
2
-
3
-
4
-
5
-
6
-
7
-
8
-
9
-
10
-
11
-
12
-
13
-
14
-
15
-
16
-
17
-
18
-
19
-
20
-
21
-
22
-
23
-
24
-
25
-
26
-
27
-
28
-
29
-
 30
30 -
 31
31 -
 32
32 -
 33
33 -
 34
34 -
 35
35 -
 36
36 -
 37
37 -
 38
38 -
 39
39 -
 40
40 -
 41
41 -
 42
42 -
 43
43 -
 44
44 -
 45
45 -
 46
46 -
 47
47 -
 48
48 -
 49
49 -
 50
50 -
51
-
52
-
53
-
54
-
55
-
56
-
57
-
58
-
59
-
60
-
61
-
62
-
63
-
64
-
65
-
66
-
67
-
68
-
69
-
70
-
71
-
72
-
73
-
74
-
75
-
76
-
77
-
78
-
79
-
80
-
81
-
82
-
83
-
84
-
85
-
86
-
87
-
88
-
89
-
90
-
91
-
92
-
93
-
94
-
95
-
96
-
97
-
98
-
99
-
100
-
101
-
102
-
103
-
104
-
105
-
106
-
107
-
108
-
109
-
110
-
111
-
112
-
113
-
114
 |
 |

24 : TCF Financial Corporation and Subsidiaries
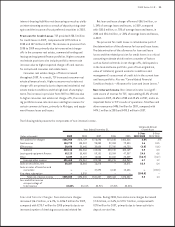
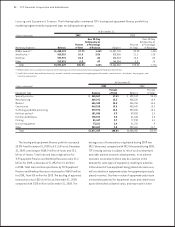
Card Revenue During 2009, card revenue, primarily
interchange fees, totaled $104.8 million, up from $103.1
million in 2008 and $98.9 million in 2007. The increases in
card revenue in 2009 and 2008 were primarily attributable
to growth in active accounts and increases in customer
transactions in 2009, partially offset by lower average trans-
action amounts. The continued success of TCF’s debit card
program is highly dependent on the success and viability
of Visa and the continued use by customers and acceptance
by merchants of its cards.
ATM Revenue ATM revenue totaled $30.4 million for 2009,
down from $32.6 million in 2008 and $35.6 million in 2007.
The declines in ATM revenue were primarily attributable to
fewer fee generating transactions by TCF customers.
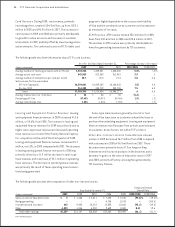
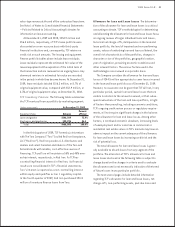
Leasing and Equipment Finance Revenue Leasing
and equipment nance revenues in 2009 increased $13.6
million, or 24.6%, from 2008. The increase in leasing and
equipment nance revenues for 2009 was primarily due to
higher sales-type lease revenue and increased operating
lease revenue as a result of the Fidelity National Capital,
Inc. acquisition at the end of the third quarter of 2009.
Leasing and equipment nance revenues decreased $3.7
million, or 6.2%, in 2008 compared with 2007. The decrease
in leasing and equipment nance revenues for 2008 was
primarily driven by a $1.9 million decrease in sales-type
lease revenues and a decrease of $2.1 million in operating
lease revenues. The decrease in operating lease revenues
was primarily the result of fewer operating lease transac-
tions being generated.
Sales-type lease revenues generally occur at or near
the end of the lease term as customers extend the lease or
purchase the underlying equipment. Leasing and equipment
nance revenues may uctuate from period to period based
on customer-driven factors not within TCF’s control.
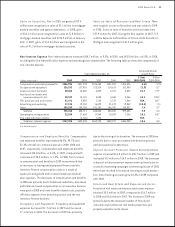
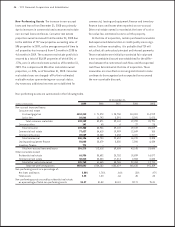
Other Non-Interest Income Total other non-interest
income in 2009 decreased $6.9 million from 2008 compared
with a decrease in 2008 of $6.5 million from 2007. These
decreases were primarily due to TCF no longer selling
investment and insurance products in the branches and a
decrease in gains on the sales of education loans in 2007
and 2008, partially offset by servicing fees generated by
TCF Inventory Finance.
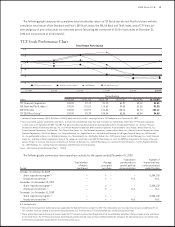
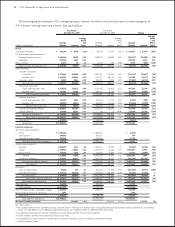
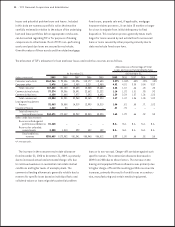
The following table presents the components of other non-interest income.
Compound Annual
Year Ended December 31, Growth Rate
(Dollars in thousands) 2008 2007 2006 2005 2009/2004
Gains on sales of education loans $ 1,456 $ 2,011 $ 7,224 $ 2,078 (79.2)%
Mortgage banking – – 4,734 5,578 (100.0)
Investments and insurance 9,405 10,318 10,695 10,665 (44.8)
Other 1,246 6,259 9,609 5,088 19.6
Total other earnings $12,107 $18,588 $32,262 $23,409 (31.7)
N.M. Not Meaningful.
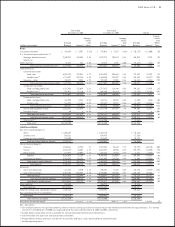
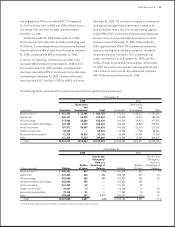
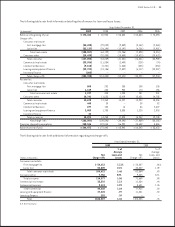
The following table sets forth information about TCF’s card business.
At or For the Year Ended December 31, Percentage Increase (Decrease)
(Dollars in thousands) 2008 2007 2008/2007
Average number of checking accounts with a TCF card 1,449,501 1,455,540 (.4)%
Average active card users 812,385 811,961 .1
Average number of transactions per card per month 20.3 19.4 4.6
Sales volume for the year ended:
Off-line (Signature) $6,429,265 $6,146,036 4.6
On-line (PIN) 850,719 802,735 6.0
Total $7,279,984 $6,948,771 4.8
Average transaction size (in dollars) $ 36 $ 36 –
Percentage off-line 88.31% 88.45% (.2)
Average interchange rate 1.34% 1.35% (.7)