TCF Bank 2009 Annual Report Download - page 65
Download and view the complete annual report
Please find page 65 of the 2009 TCF Bank annual report below. You can navigate through the pages in the report by either clicking on the pages listed below, or by using the keyword search tool below to find specific information within the annual report.-
 1
1 -
2
-
3
-
4
-
5
-
6
-
7
-
8
-
9
-
10
-
11
-
12
-
13
-
14
-
15
-
16
-
17
-
18
-
19
-
20
-
21
-
22
-
23
-
24
-
25
-
26
-
27
-
28
-
29
-
30
-
31
-
32
-
33
-
34
-
35
-
36
-
37
-
38
-
39
-
40
-
41
-
42
-
43
-
44
-
45
-
46
-
47
-
48
-
49
-
50
-
51
-
52
-
53
-
54
-
 55
55 -
 56
56 -
 57
57 -
 58
58 -
 59
59 -
 60
60 -
 61
61 -
 62
62 -
 63
63 -
 64
64 -
 65
65 -
 66
66 -
 67
67 -
 68
68 -
 69
69 -
 70
70 -
 71
71 -
 72
72 -
 73
73 -
 74
74 -
 75
75 -
76
-
77
-
78
-
79
-
80
-
81
-
82
-
83
-
84
-
85
-
86
-
87
-
88
-
89
-
90
-
91
-
92
-
93
-
94
-
95
-
96
-
97
-
98
-
99
-
100
-
101
-
102
-
103
-
104
-
105
-
106
-
107
-
108
-
109
-
110
-
111
-
112
-
113
-
114
 |
 |

2009 Form 10-K : 49
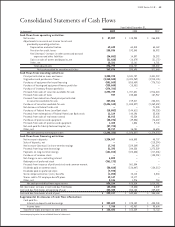
Consolidated Statements of Cash Flows
Year Ended December 31,
(In thousands) 2008 2007
Net income $ 128,958 $ 266,808
Adjustments to reconcile net income to net cash
provided by operating activities:
Depreciation and amortization 64,813 64,169
Provision for credit losses 192,045 56,992
Net (decrease) increase in other assets and accrued
expenses and other liabilities 14,397 28,292
Gains on sales of assets and deposits, net (16,679) (51,172)
Other, net 12,161 6,751
Total adjustments 266,737 105,032
Net cash provided by operating activities 395,695 371,840
Principal collected on loans and leases 3,041,757 3,341,219
Originations and purchases of loans (3,494,969) (3,918,105)
Purchases of equipment for lease nancing (850,459) (776,716)
Purchase of leasing and equipment nance portfolios (15,001) –
Purchase of inventory nance portfolios – –
Proceeds from sales of securities available for sale 1,707,821 1,916,424
Proceeds from sales of loans 245,884 187,967
Proceeds from maturities of and principal collected
on securities available for sale 219,017 234,215
Purchases of securities available for sale (1,888,527) (2,369,452)
Net decrease in federal funds sold – 71,000
Purchases of Federal Home Loan Bank stock (144,611) (95,226)
Proceeds from redemptions of Federal Home Loan Bank stock 140,196 53,008
Proceeds from sales of real estate owned 43,324 33,635
Purchases of premises and equipment (49,556) (76,637)
Proceeds from sales of premises and equipment 1,546 9,743
Net cash paid for Fidelity National Capital, Inc. – –
Other, net 16,751 14,653
Net cash used by investing activities (1,026,827) (1,374,272)
Net increase in deposits 666,803 48,707
Sales of deposits, net – (213,294)
Net increase (decrease) in short-term borrowings (329,209) 341,957
Proceeds from long-term borrowings 344,258 1,275,329
Payments on long-term borrowings (323,348) (217,406)
Purchases of common stock – (105,251)
Net change in non-controlling interest – –
Redemption of preferred stock – –
Proceeds from issuance of preferred stock and common warrant 361,004 –
Dividends paid on common stock (126,447) (124,513)
Dividends paid on preferred stock – –
Stock compensation tax (costs) benets 10,110 4,534
Shares sold to TCF employee benet plans 10,177 –
Other, net 1,976 718
Net cash provided by nancing activities 615,324 1,010,781
Net (decrease) increase in cash and due from banks (15,808) 8,349
Cash and due from banks at beginning of year 358,188 349,839
Cash and due from banks at end of year $ 342,380 $ 358,188
Cash paid for:
Interest on deposits and borrowings $ 378,132 $ 408,248
Income taxes $ 42,957 $ 93,634
Transfer of loans and leases to other assets $ 103,359 $ 73,733
See accompanying notes to consolidated nancial statements.