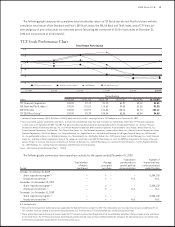
TCF Bank 2009 Annual Report Download - page 37
Download and view the complete annual report
Please find page 37 of the 2009 TCF Bank annual report below. You can navigate through the pages in the report by either clicking on the pages listed below, or by using the keyword search tool below to find specific information within the annual report.-
 1
1 -
2
-
3
-
4
-
5
-
6
-
7
-
8
-
9
-
10
-
11
-
12
-
13
-
14
-
15
-
16
-
17
-
18
-
19
-
20
-
21
-
22
-
23
-
24
-
25
-
26
-
 27
27 -
 28
28 -
 29
29 -
 30
30 -
 31
31 -
 32
32 -
 33
33 -
 34
34 -
 35
35 -
 36
36 -
 37
37 -
 38
38 -
 39
39 -
 40
40 -
 41
41 -
 42
42 -
 43
43 -
 44
44 -
 45
45 -
 46
46 -
 47
47 -
48
-
49
-
50
-
51
-
52
-
53
-
54
-
55
-
56
-
57
-
58
-
59
-
60
-
61
-
62
-
63
-
64
-
65
-
66
-
67
-
68
-
69
-
70
-
71
-
72
-
73
-
74
-
75
-
76
-
77
-
78
-
79
-
80
-
81
-
82
-
83
-
84
-
85
-
86
-
87
-
88
-
89
-
90
-
91
-
92
-
93
-
94
-
95
-
96
-
97
-
98
-
99
-
100
-
101
-
102
-
103
-
104
-
105
-
106
-
107
-
108
-
109
-
110
-
111
-
112
-
113
-
114
 |
 |

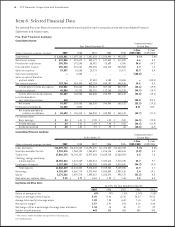
2009 Form 10-K : 21
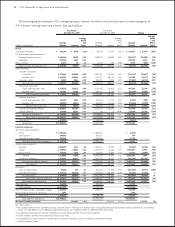
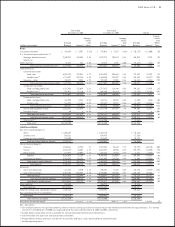
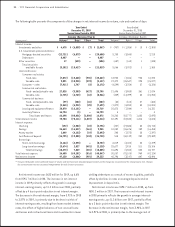
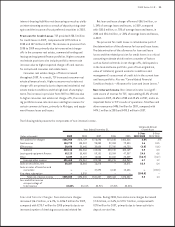
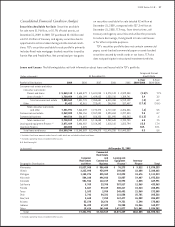
Year Ended Year Ended
December 31, 2008 December 31, 2007 Change
Average
Average Average Yields
Yields Yields and
Average and Average and Average Rates
(Dollars in thousands) Balance Interest(1) Rates Balance Interest (1) Rates Balance Interest(1) (bps)
Investments and other $ 155,839 $ 5,937 3.81% $ 178,012 $ 8,237 4.63% $ (22,173) $ (2,300) (82)
U.S. Government sponsored entities: (2)
Mortgage-backed securities 2,100,291 110,502 5.26 1,992,272 108,289 5.44 108,019 2,213 (18)
Debentures – – – – – – – – –
Other securities 12,674 444 3.50 32,291 1,292 4.00 (19,617) (848) (50)
Total securities available for sale (3) 2,112,965 110,946 5.25 2,024,563 109,581 5.41 88,402 1,365 (16)
Loans and leases:
Consumer real estate:
Fixed-rate 5,532,198 372,067 6.73 5,258,299 359,844 6.84 273,899 12,223 (11)
Variable-rate (3) 1,714,827 109,115 6.36 1,460,685 124,992 8.56 254,142 (15,877) (220)
Consumer — other 132,891 9,233 6.95 198,105 17,559 8.86 (65,214) (8,326) (191)
Total consumer real estate and other 7,379,916 490,415 6.65 6,917,089 502,395 7.26 462,827 (11,980) (61)
Commercial real estate:
Fixed- and adjustable-rate 2,127,436 132,014 6.21 1,777,813 114,140 6.42 349,623 17,874 (21)
Variable-rate (3) 597,071 31,110 5.21 608,209 46,363 7.62 (11,138) (15,253) (241)
Total commercial real estate 2,724,507 163,124 5.99 2,386,022 160,503 6.73 338,485 2,621 (74)
Commercial business:
Fixed- and adjustable-rate 168,554 9,988 5.93 169,776 10,853 6.39 (1,222) (865) (46)
Variable-rate 366,593 18,143 4.95 393,442 28,947 7.36 (26,849) (10,804) (241)
Total commercial business 535,147 28,131 5.26 563,218 39,800 7.07 (28,071) (11,669) (181)
Leasing and equipment nance 2,265,391 165,838 7.32 1,915,790 147,507 7.70 349,601 18,331 (38)
Inventory nance 40 4 10.00 – – – 40 4 1,000
Total loans and leases (4) 12,905,001 847,512 6.57 11,782,119 850,205 7.22 1,122,882 (2,693) (65)
Total interest-earning assets 15,173,805 964,395 6.36 13,984,694 968,023 6.92 1,189,111 (3,628) (56)
Other assets (5) 1,158,545 1,161,106 (2,561)
Total assets $16,332,350 $15,145,800 $1,186,550
Non-interest bearing deposits:
Retail $ 1,408,657 $ 1,444,125 $ (35,468)
Small business 583,611 594,979 (11,368)
Commercial and custodial 231,903 199,432 32,471
Total non-interest bearing deposits 2,224,171 2,238,536 (14,365)
Interest-bearing deposits:
Checking 1,830,361 12,933 .71 1,879,333 33,643 1.79 (48,972) (20,710) (108)
Savings 2,812,115 48,601 1.73 2,464,333 65,056 2.64 347,782 (16,455) (91)
Money market 613,543 10,099 1.65 604,767 17,396 2.88 8,776 (7,297) (123)
Subtotal 5,256,019 71,633 1.37 4,948,433 116,095 2.35 307,586 (44,462) (98)
Certicates of deposit 2,472,357 85,141 3.44 2,461,055 114,530 4.65 11,302 (29,389) (121)
Total interest-bearing deposits 7,728,376 156,774 2.03 7,409,488 230,625 3.11 318,888 (73,851) (108)
Total deposits 9,952,547 156,774 1.58 9,648,024 230,625 2.39 304,523 (73,851) (81)
Borrowings:
Short-term borrowings 411,763 8,990 2.18 230,293 11,369 4.94 181,470 (2,379) (276)
Long-term borrowings 4,459,703 204,958 4.60 3,890,054 175,852 4.52 569,649 29,106 8
Total borrowings 4,871,466 213,948 4.39 4,120,347 187,221 4.54 751,119 26,727 (15)
Total interest-bearing liabilities 12,599,842 370,722 2.94 11,529,835 417,846 3.62 1,070,007 (47,124) (68)
Total deposits and borrowings 14,824,013 370,722 2.50 13,768,371 417,846 3.03 1,055,642 (47,124) (53)
Other liabilities 359,223 343,978 15,245
Total liabilities 15,183,236 14,112,349 1,070,887
Total TCF Financial Corp. stockholders’ equity 1,149,114 1,033,451 115,663
Non-controlling interest in subsidiaries – – –
Total equity 1,149,114 1,033,451 115,663
Total liabilities and equity $16,332,350 $15,145,800 $1,186,550
Net interest income and margin $593,673 3.91% $550,177 3.94% $ 43,496 (3)
bps = basis points.
(1) Tax-exempt income was not signicant and thus yields on interest-earning assets and net interest margin have not been presented on a tax equivalent basis. Tax-exempt
income of $1,679,000 and $1,933,000 was recognized during the years ended December 31, 2008 and 2007, respectively.
(2) Average balance and yield of securities available for sale are based upon the historical amortized cost.
(3) Certain variable-rate loans have contractual interest rate oors.
(4) Average balance of loans and leases includes non-accrual loans and leases, and is presented net of unearned income.
(5) Includes operating leases.