TCF Bank 2009 Annual Report Download - page 46
Download and view the complete annual report
Please find page 46 of the 2009 TCF Bank annual report below. You can navigate through the pages in the report by either clicking on the pages listed below, or by using the keyword search tool below to find specific information within the annual report.-
 1
1 -
2
-
3
-
4
-
5
-
6
-
7
-
8
-
9
-
10
-
11
-
12
-
13
-
14
-
15
-
16
-
17
-
18
-
19
-
20
-
21
-
22
-
23
-
24
-
25
-
26
-
27
-
28
-
29
-
30
-
31
-
32
-
33
-
34
-
35
-
 36
36 -
 37
37 -
 38
38 -
 39
39 -
 40
40 -
 41
41 -
 42
42 -
 43
43 -
 44
44 -
 45
45 -
 46
46 -
 47
47 -
 48
48 -
 49
49 -
 50
50 -
 51
51 -
 52
52 -
 53
53 -
 54
54 -
 55
55 -
 56
56 -
57
-
58
-
59
-
60
-
61
-
62
-
63
-
64
-
65
-
66
-
67
-
68
-
69
-
70
-
71
-
72
-
73
-
74
-
75
-
76
-
77
-
78
-
79
-
80
-
81
-
82
-
83
-
84
-
85
-
86
-
87
-
88
-
89
-
90
-
91
-
92
-
93
-
94
-
95
-
96
-
97
-
98
-
99
-
100
-
101
-
102
-
103
-
104
-
105
-
106
-
107
-
108
-
109
-
110
-
111
-
112
-
113
-
114
 |
 |

30 : TCF Financial Corporation and Subsidiaries
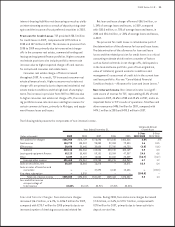
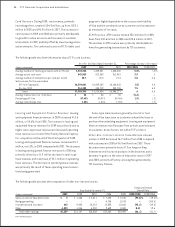
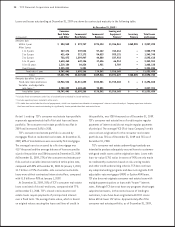
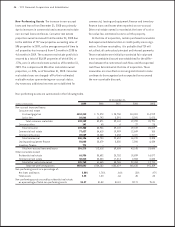
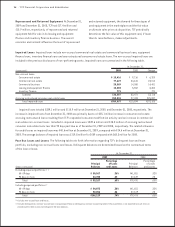
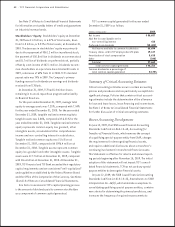
The leasing and equipment nance portfolio increased
23.5% from December 31, 2008 to $3.1 billion at December
31, 2009, consisting of $868.9 million of loans and $2.2
billion of leases. Total loan and lease originations for
TCF Equipment Finance and Winthrop Resources were $1.2
billion for 2009, a decrease of 11.8% from $1.4 billion
in 2008. Total loan and lease purchases by TCF Equipment
Finance and Winthrop Resources increased to $563.9 million
for 2009, from $15 million for 2008. The backlog of approved
transactions was $322.6 million at December 31, 2009,
compared with $328 million at December 31, 2008. The
average size of transactions originated during 2009 was
$82.7 thousand, compared with $92.3 thousand during 2008.
TCF’s leasing activity is subject to risk of cyclical downturns
and other adverse economic developments. In an adverse
economic environment, there may be a decline in the
demand for some types of equipment, resulting in a decline
in the amount of new equipment being placed into service as
well as a decline in equipment values for equipment previously
placed in service. Declines in value of equipment under lease
increase the potential for impairment losses and credit losses
due to diminished collateral value, and may result in lower
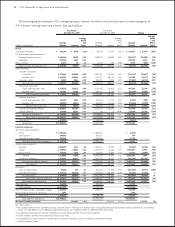
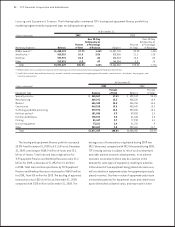
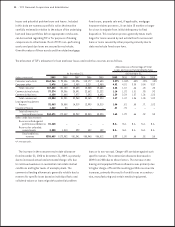
Leasing and Equipment Finance The following tables summarize TCF’s leasing and equipment nance portfolio by
marketing segment and by equipment type, excluding operating leases.
At December 31,
(Dollars in thousands) 2008
Over 30-Day
Delinquency as
Percent a Percentage
Marketing Segment Balance of Total of Balance
Middle market (1) $1,487,749 59.8% 1.45%
Small ticket (2) 525,686 21.1 1.35
Winthrop 328,553 13.2 .08
Other 144,094 5.9 .16
Total $2,486,082 100.0% 1.17%
(1) Middle market consists primarily of loan and lease nancing of construction and manufacturing equipment and specialty vehicles.
(2) Small ticket includes loan and lease nancings to small- and mid-size companies through programs with vendors, manufacturers, distributors, buying groups, and
franchise organizations.
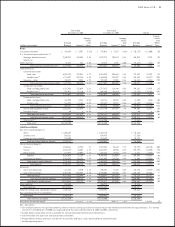
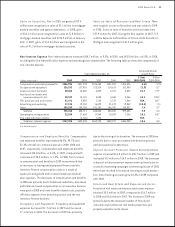
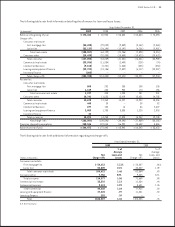
At December 31,
(Dollars in thousands) 2008
Percent
Equipment Type Balance of Total
Specialty vehicles $ 499,519 20.1%
Manufacturing 406,532 16.4
Medical 356,706 14.3
Construction 453,542 18.2
Technology and data processing 259,696 10.4
Golf cart and turf 59,823 2.4
Furniture and xtures 61,443 2.5
Printing 77,939 3.1
Exercise equipment 21,231 .9
Other 289,651 11.7
Total $2,486,082 100.0%