TCF Bank 2009 Annual Report Download - page 63
Download and view the complete annual report
Please find page 63 of the 2009 TCF Bank annual report below. You can navigate through the pages in the report by either clicking on the pages listed below, or by using the keyword search tool below to find specific information within the annual report.
2009 Form 10-K : 47
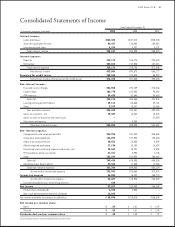
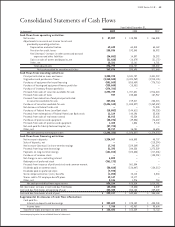
Consolidated Statements of Income
Year Ended December 31,
(In thousands, except per-share data) 2008 2007
Loans and leases $847,512 $850,205
Securities available for sale 110,946 109,581
Investments and other 5,937 8,237
Total interest income 964,395 968,023
Deposits 156,774 230,625
Borrowings 213,948 187,221
Total interest expense 370,722 417,846
Net interest income 593,673 550,177
192,045 56,992
Net interest income after provision for credit losses 401,628 493,185
Fees and service charges 270,739 278,046
Card revenue 103,082 98,880
ATM revenue 32,645 35,620
Subtotal 406,466 412,546
Leasing and equipment nance 55,488 59,151
Other 12,107 18,588
Fees and other revenue 474,061 490,285
Gains on securities, net 16,066 13,278
Gains on sales of branches and real estate – 37,894
Visa share redemption 8,308 –
Total non-interest income 498,435 541,457
Compensation and employee benets 341,203 346,468
Occupancy and equipment 127,953 120,824
Deposit account premiums 16,888 4,849
Advertising and marketing 19,150 16,829
Foreclosed real estate and repossessed assets, net 18,731 5,558
FDIC premiums and assessments 2,990 1,145
Other 150,030 148,863
Subtotal 676,945 644,536
Operating lease depreciation 17,458 17,588
Total non-interest expense 694,403 662,124
Income before income tax expense 205,660 372,518
76,702 105,710
Income after income tax expense 128,958 266,808
Loss attributable to non-controlling interest – –
128,958 266,808
Preferred stock dividends 2,540 –
Non-cash deemed preferred stock dividend – –
Net income available to common stockholders $126,418 $266,808
Basic $ 1.01 $ 2.09
Diluted $ 1.01 $ 2.09
$ 1.00 $ .97
See accompanying notes to consolidated nancial statements.


