TCF Bank 2009 Annual Report Download - page 54
Download and view the complete annual report
Please find page 54 of the 2009 TCF Bank annual report below. You can navigate through the pages in the report by either clicking on the pages listed below, or by using the keyword search tool below to find specific information within the annual report.-
 1
1 -
2
-
3
-
4
-
5
-
6
-
7
-
8
-
9
-
10
-
11
-
12
-
13
-
14
-
15
-
16
-
17
-
18
-
19
-
20
-
21
-
22
-
23
-
24
-
25
-
26
-
27
-
28
-
29
-
30
-
31
-
32
-
33
-
34
-
35
-
36
-
37
-
38
-
39
-
40
-
41
-
42
-
43
-
 44
44 -
 45
45 -
 46
46 -
 47
47 -
 48
48 -
 49
49 -
 50
50 -
 51
51 -
 52
52 -
 53
53 -
 54
54 -
 55
55 -
 56
56 -
 57
57 -
 58
58 -
 59
59 -
 60
60 -
 61
61 -
 62
62 -
 63
63 -
 64
64 -
65
-
66
-
67
-
68
-
69
-
70
-
71
-
72
-
73
-
74
-
75
-
76
-
77
-
78
-
79
-
80
-
81
-
82
-
83
-
84
-
85
-
86
-
87
-
88
-
89
-
90
-
91
-
92
-
93
-
94
-
95
-
96
-
97
-
98
-
99
-
100
-
101
-
102
-
103
-
104
-
105
-
106
-
107
-
108
-
109
-
110
-
111
-
112
-
113
-
114
 |
 |

38 : TCF Financial Corporation and Subsidiaries
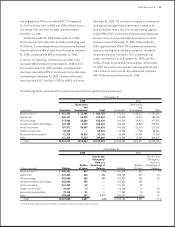
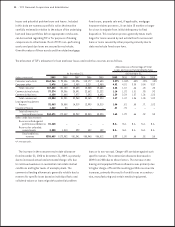
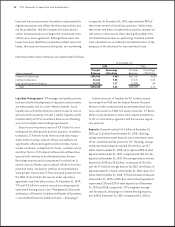
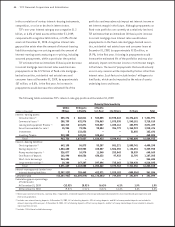
Potential problem loans and leases are summarized as follows.
At December 31,
2008
Principal Percentage
(Dollars in thousands) Balances of Portfolio
Commercial real estate $137,332 4.60%
Commercial business 27,127 5.35
Leasing and equipment nance 20,994 .84
Total $185,453 3.10
loans and leases are primarily classied as substandard for
regulatory purposes and reect the distinct possibility, but
not the probability, that the Company will not be able to
collect all amounts due according to the contractual terms
of the loan or lease agreement. Although these loans and
leases have been identied as potential problem loans and
leases, they may never become delinquent, non-performing
or impaired. At December 31, 2009, approximately 98% of
these loans were less than 60 days past due. Additionally,
these loans and leases are generally secured by commercial
real estate or other assets, thus reducing the potential for
loss should they become non-performing. Potential problem
loans and leases are considered in the determination of the
adequacy of the allowance for loan and lease losses.
TCF manages its liquidity position
to ensure that the funding needs of depositors and borrowers
are met promptly and in a cost-effective manner. Asset
liquidity arises from the ability to convert assets to cash as
well as from the maturity of assets. Liability liquidity results
from the ability of TCF to maintain a diverse set of funding
sources to promptly meet funding requirements.
Deposits are the primary source of TCF’s funds for use in
lending and for other general business purposes. In addition
to deposits, TCF derives funds from loan and lease repay-
ments and borrowings. Deposit inows and outows are
signicantly inuenced by general interest rates, money
market conditions, competition for funds, customer service
and other factors. TCF’s deposit inows and outows have
been and will continue to be affected by these factors.
Borrowings may be used to compensate for reductions in
normal sources of funds, such as deposit inows at less than
projected levels, net deposit outows or to fund balance
sheet growth. Historically, TCF has borrowed primarily from
the FHLB, from institutional sources under repurchase
agreements and from other sources. At December 31, 2009,
TCF had $2.8 billion in unused secured borrowing capacity
under these funding sources. See “Management’s Discussion
and Analysis of Financial Condition and Results of Operations
– Consolidated Financial Condition Analysis – Borrowings.”
Potential sources of liquidity for TCF include secured
borrowings from FHLB and the Federal Reserve Discount
Window or other unsecured and uncommitted short-term
lines, and issuance of debt and equity securities. TCF Bank’s
ability to pay dividends or make other capital distributions
to TCF is restricted by regulation and may require regula-
tory approval.
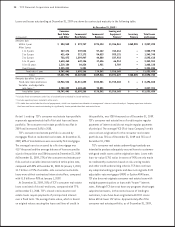
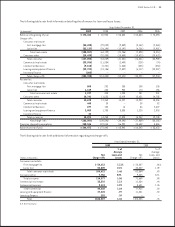
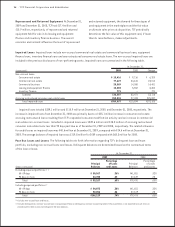
Deposits totaled $11.6 billion at December 31,
2009, up $1.3 billion from December 31, 2008. Checking,
savings and money market deposits are an important source
of low-cost funds and fee income for TCF. Checking, savings
and money market deposits totaled $10.4 billion, up $2.7
billion from December 31, 2008, and comprised 90% of total
deposits at December 31, 2009, compared with 75% of total
deposits at December 31, 2008. The average balance of these
deposits for 2009 was $9.5 billion, an increase of $2 billion
over the $7.5 billion average balance for 2008. Certicates of
deposit totaled $1.2 billion at December 31, 2009, down $1.4
billion from December 31, 2008. TCF had no brokered deposits
at December 31, 2009 or 2008. Non-interest bearing deposits
represented 21% and 22% of total deposits as of December
31, 2009 and 2008, respectively. TCF’s weighted-average
cost for deposits, including non-interest bearing deposits,
was .65% at December 31, 2009, compared with 1.61% at