TCF Bank 2009 Annual Report Download - page 39
Download and view the complete annual report
Please find page 39 of the 2009 TCF Bank annual report below. You can navigate through the pages in the report by either clicking on the pages listed below, or by using the keyword search tool below to find specific information within the annual report.-
 1
1 -
2
-
3
-
4
-
5
-
6
-
7
-
8
-
9
-
10
-
11
-
12
-
13
-
14
-
15
-
16
-
17
-
18
-
19
-
20
-
21
-
22
-
23
-
24
-
25
-
26
-
27
-
28
-
 29
29 -
 30
30 -
 31
31 -
 32
32 -
 33
33 -
 34
34 -
 35
35 -
 36
36 -
 37
37 -
 38
38 -
 39
39 -
 40
40 -
 41
41 -
 42
42 -
 43
43 -
 44
44 -
 45
45 -
 46
46 -
 47
47 -
 48
48 -
 49
49 -
50
-
51
-
52
-
53
-
54
-
55
-
56
-
57
-
58
-
59
-
60
-
61
-
62
-
63
-
64
-
65
-
66
-
67
-
68
-
69
-
70
-
71
-
72
-
73
-
74
-
75
-
76
-
77
-
78
-
79
-
80
-
81
-
82
-
83
-
84
-
85
-
86
-
87
-
88
-
89
-
90
-
91
-
92
-
93
-
94
-
95
-
96
-
97
-
98
-
99
-
100
-
101
-
102
-
103
-
104
-
105
-
106
-
107
-
108
-
109
-
110
-
111
-
112
-
113
-
114
 |
 |

2009 Form 10-K : 23
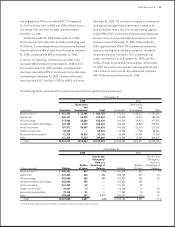
interest-bearing liabilities not decreasing as much as yields
on interest earning assets as a result of deposit pricing strat-
egies and the issuance of trust preferred securities in 2008.
TCF provided $258.5 million
for credit losses in 2009, compared with $192 million in
2008 and $57 million in 2007. The increase in provision from
2008 to 2009 was primarily due to increased net charge-
offs in the consumer real estate, commercial lending and
leasing and equipment nance portfolios. Higher consumer
real estate provisions also include portfolio reserve rate
increases due to higher expected charge-offs and reserves
for restructured consumer real estate loans.
Consumer real estate charge-off rates increased
throughout 2009. As a result, TCF increased consumer real
estate allowance levels. Higher consumer real estate net
charge-offs are primarily due to depressed residential real
estate market conditions and the high level of unemploy-
ment. The increase in provision from 2007 to 2008 was due
to higher consumer real estate net charge-offs, the result-
ing portfolio reserve rate increases and higher reserves for
certain commercial loans, primarily in Michigan, and equip-
ment nance loans and leases.
Net loan and lease charge-offs were $186.5 million, or
1.34% of average loans and leases, in 2009, compared
with $100.5 million, or .78% of average loans and leases, in
2008 and $34.6 million, or .30% of average loans and leases,
in 2007.
The provision for credit losses is calculated as part of
the determination of the allowance for loan and lease losses.
The determination of the allowance for loan and lease
losses and the related provision for credit losses is a critical
accounting estimate which involves a number of factors
such as historical trends in net charge-offs, delinquencies
in the loan and lease portfolio, year of loan origination,
value of collateral, general economic conditions and
management’s assessment of credit risk in the current loan
and lease portfolio. Also see “Consolidated Financial
Condition Analysis — Allowance for Loan and Lease Losses.”
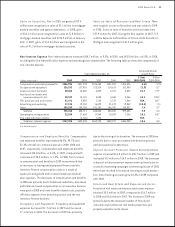
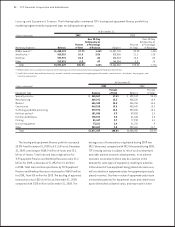
Non-interest income is a signi-
cant source of revenue for TCF, representing 45.4% of total
revenues in 2009, 45.6% in 2008 and 49.6% in 2007, and is an
important factor in TCF’s results of operations. Total fees and
other revenue was $496.5 million for 2009, compared with
$474.1 million in 2008 and $490.3 million in 2007.
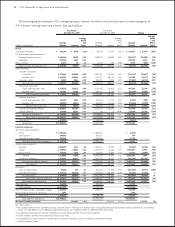
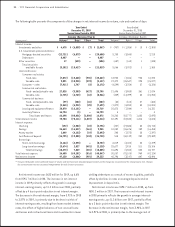
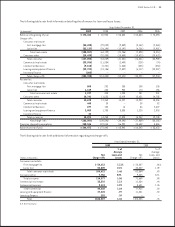
The following table presents the components of non-interest income.
Compound Annual
Year Ended December 31, Growth Rate
5-Year
(Dollars in thousands) 2008 2007 2006 2005 2009/2004
Fees and service charges $270,739 $278,046 $270,166 $262,636 .8%
Card revenue 103,082 98,880 92,084 79,803 10.5
ATM revenue 32,645 35,620 37,760 40,730 (6.6)
Subtotal 406,466 412,546 400,010 383,169 2.0
Leasing and equipment nance 55,488 59,151 53,004 47,387 6.6
Other 12,107 18,588 32,262 23,409 (31.7)
Fees and other revenue 474,061 490,285 485,276 453,965 1.2
Gains on securities, net 16,066 13,278 – 10,671 5.4
Gains on sales of branches and
real estate – 37,894 4,188 13,606 (100.0)
Visa share redemption 8,308 – – – –
Total non-interest income $498,435 $541,457 $489,464 $478,242 1.4
Fees and other revenue
as a percentage of
total revenue 43.41% 44.91% 47.25% 45.58%
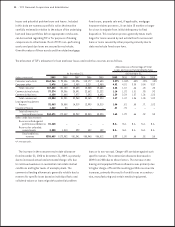
Fees and Service Charges Fees and service charges
increased $16.2 million, or 6.0%, to $286.9 million for 2009,
compared with $270.7 million for 2008 primarily due to an
increased number of checking accounts and related fee
income. During 2008, fees and service charges decreased
$7.3 million, or 2.6%, to $270.7 million, compared with
$278 million for 2007, primarily due to lower activity in
deposit service fees.