TCF Bank 2009 Annual Report Download - page 71
Download and view the complete annual report
Please find page 71 of the 2009 TCF Bank annual report below. You can navigate through the pages in the report by either clicking on the pages listed below, or by using the keyword search tool below to find specific information within the annual report.-
 1
1 -
2
-
3
-
4
-
5
-
6
-
7
-
8
-
9
-
10
-
11
-
12
-
13
-
14
-
15
-
16
-
17
-
18
-
19
-
20
-
21
-
22
-
23
-
24
-
25
-
26
-
27
-
28
-
29
-
30
-
31
-
32
-
33
-
34
-
35
-
36
-
37
-
38
-
39
-
40
-
41
-
42
-
43
-
44
-
45
-
46
-
47
-
48
-
49
-
50
-
51
-
52
-
53
-
54
-
55
-
56
-
57
-
58
-
59
-
60
-
 61
61 -
 62
62 -
 63
63 -
 64
64 -
 65
65 -
 66
66 -
 67
67 -
 68
68 -
 69
69 -
 70
70 -
 71
71 -
 72
72 -
 73
73 -
 74
74 -
 75
75 -
 76
76 -
 77
77 -
 78
78 -
 79
79 -
 80
80 -
 81
81 -
82
-
83
-
84
-
85
-
86
-
87
-
88
-
89
-
90
-
91
-
92
-
93
-
94
-
95
-
96
-
97
-
98
-
99
-
100
-
101
-
102
-
103
-
104
-
105
-
106
-
107
-
108
-
109
-
110
-
111
-
112
-
113
-
114
 |
 |

2009 Form 10-K : 55
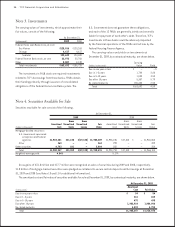
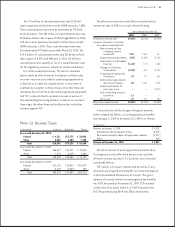
The following table shows the securities available for sale portfolio’s gross unrealized losses and fair value, aggregated
by investment category and length of time that individual securities have been in a continuous unrealized loss position.
Unrealized losses on securities available for sale are due to changes in interest rates and not due to credit quality issues.
TCF has the ability and intent to hold these investments until a recovery of fair value. Accordingly, TCF has concluded that
no other-than-temporary impairment has occurred at December 31, 2009.
(In thousands)
U.S. Government sponsored entities:
Mortgage-backed securities
At December 31, 2008, TCF had no securities in an unrealized loss position within the available for sale portfolio.
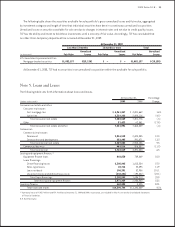
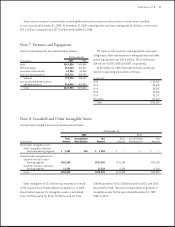
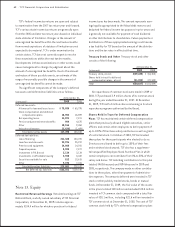
Note 5. Loans and Leases
The following table sets forth information about loans and leases.
At December 31, Percentage
(Dollars in thousands) 2008 Change
Consumer real estate and other:
Consumer real estate:
First mortgage lien $ 4,881,662 1.6%
Junior lien 2,420,116 (4.2)
Total consumer real estate 7,301,778 (.3)
Other 62,561 (17.8)
Total consumer real estate and other 7,364,339 (.4)
Commercial:
Commercial real estate:
Permanent 2,693,085 12.0
Construction and development 291,071 13.3
Total commercial real estate 2,984,156 9.5
Commercial business 506,887 (11.3)
Total commercial 3,491,043 6.5
Leasing and equipment nance: (1)
Equipment nance loans 789,869 10.0
Lease nancings:
Direct nancing leases 1,813,254 27.2
Sales-type leases 22,095 11.9
Lease residuals 52,906 101.1
Unearned income and deferred lease costs (192,042) (22.1)
Total lease nancings 1,696,213 29.9
Total leasing and equipment nance 2,486,082 23.5
Inventory nance 4,425 N.M.
Total loans and leases $13,345,889 9.3%
(1) Operating leases of $105.9 million and $58.8 million at December 31, 2009 and 2008, respectively, are included in Other Assets on the Consolidated Statements
of Financial Condition.
N.M. Not Meaningful.