Supercuts 2010 Annual Report Download - page 61
Download and view the complete annual report
Please find page 61 of the 2010 Supercuts annual report below. You can navigate through the pages in the report by either clicking on the pages listed below, or by using the keyword search tool below to find specific information within the annual report.-
 1
1 -
2
-
3
-
4
-
5
-
6
-
7
-
8
-
9
-
10
-
11
-
12
-
13
-
14
-
15
-
16
-
17
-
18
-
19
-
20
-
21
-
22
-
23
-
24
-
25
-
26
-
27
-
28
-
29
-
30
-
31
-
32
-
33
-
34
-
35
-
36
-
37
-
38
-
39
-
40
-
41
-
42
-
43
-
44
-
45
-
46
-
47
-
48
-
49
-
50
-
 51
51 -
 52
52 -
 53
53 -
 54
54 -
 55
55 -
 56
56 -
 57
57 -
 58
58 -
 59
59 -
 60
60 -
 61
61 -
 62
62 -
 63
63 -
 64
64 -
 65
65 -
 66
66 -
 67
67 -
 68
68 -
 69
69 -
 70
70 -
 71
71 -
72
-
73
-
74
-
75
-
76
-
77
-
78
-
79
-
80
-
81
-
82
-
83
-
84
-
85
-
86
-
87
-
88
-
89
-
90
-
91
-
92
-
93
-
94
-
95
-
96
-
97
-
98
-
99
-
100
-
101
-
102
-
103
-
104
-
105
-
106
-
107
-
108
-
109
-
110
-
111
-
112
-
113
-
114
-
115
-
116
-
117
-
118
-
119
-
120
-
121
-
122
-
123
-
124
-
125
-
126
-
127
-
128
-
129
-
130
-
131
-
132
-
133
-
134
-
135
-
136
-
137
-
138
-
139
-
140
-
141
-
142
-
143
-
144
-
145
-
146
-
147
-
148
-
149
-
150
-
151
-
152
-
153
-
154
-
155
-
156
-
157
-
158
-
159
-
160
-
161
-
162
-
163
-
164
-
165
-
166
-
167
-
168
-
169
-
170
-
171
-
172
-
173
-
174
-
175
-
176
-
177
-
178
-
179
-
180
-
181
-
182
-
183
-
184
-
185
-
186
-
187
-
188
-
189
-
190
-
191
-
192
-
193
-
194
-
195
-
196
-
197
-
198
-
199
-
200
-
201
-
202
-
203
-
204
-
205
-
206
-
207
-
208
-
209
-
210
-
211
-
212
-
213
-
214
-
215
-
216
-
217
-
218
-
219
-
220
-
221
 |
 |

Table of Contents
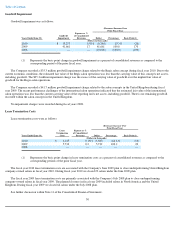
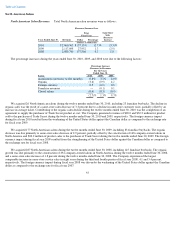
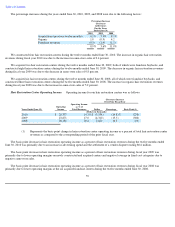
The percentage increases during the years ended June 30, 2010, 2009, and 2008 were due to the following factors:
We constructed four hair restoration centers during the twelve months ended June 30, 2010. The increase in organic hair restoration
revenues during fiscal year 2010 was due to the increase in same-store sales of 0.4 percent.
We acquired two hair restoration centers during the twelve months ended June 30, 2009, both of which were franchise buybacks, and
constructed eight hair restoration centers during the twelve months ended June 30, 2009. The decrease in organic hair restoration revenues
during fiscal year 2009 was due to the decrease in same-store sales of 0.8 percent.
We acquired six hair restoration centers during the twelve months ended June 30, 2008, all of which were franchise buybacks, and
constructed three hair restoration centers during the twelve months ended June 30, 2008. The increase in organic hair restoration revenues
during fiscal year 2008 was due to the increase in same-store sales of 5.2 percent.
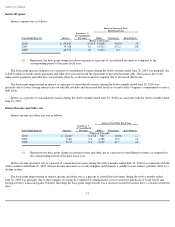
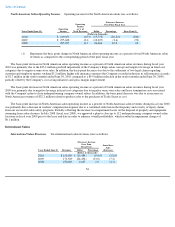
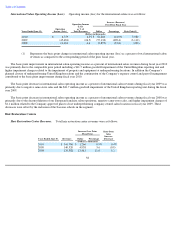
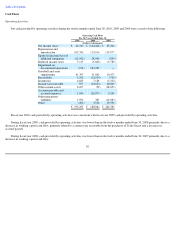
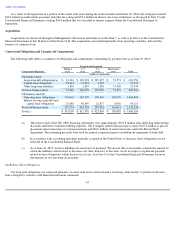
Hair Restoration Center Operating Income. Operating income for our hair restoration centers was as follows:
The basis point decrease in hair restoration operating income as a percent of hair restoration revenues during the twelve months ended
June 30, 2010 was primarily due to an increase in advertising spend and the settlement of a vendor dispute totaling $0.6 million.
The basis point decrease in hair restoration operating income as a percent of hair restoration revenues during fiscal year 2009 was
primarily due to lower operating margins on newly constructed and acquired centers and negative leverage in fixed cost categories due to
negative same-store sales.
The basis point decrease in hair restoration operating income as a percent of hair restoration revenues during fiscal year 2008 was
primarily due to lower operating margins at the six acquired franchise centers during the twelve months ended June 30, 2008.
59
Percentage Increase
(Decrease)
in Revenues
For the Years
Ended June 30,
2010 2009 2008
Acquisitions (previous twelve months)
0.2
%
5.9
%
8.1
%
Organic
1.0
(0.9
)
4.2
Franchise revenues
(0.3
)
(1.4
)
(1.3
)
0.9
%
3.6
%
11.0
%
(Decrease) Increase
Over Prior Fiscal Year
Years Ended June 30, Operating
Income
Operating Income
as % of
Total Revenues Dollar Percentage Basis Point(1)
(Dollars in thousands)
2010
$
20,337
14.3
%
$
(3,534
)
(14.8
)%
(270
)
2009
23,871
17.0
(4,310
)
(15.3
)
(380
)
2008
28,181
20.8
2,620
10.3
(10
)
(1) Represents the basis point change in hair restoration center operating income as a percent of total hair restoration center
revenues as compared to the corresponding period of the prior fiscal year.