Supercuts 2010 Annual Report Download - page 55
Download and view the complete annual report
Please find page 55 of the 2010 Supercuts annual report below. You can navigate through the pages in the report by either clicking on the pages listed below, or by using the keyword search tool below to find specific information within the annual report.-
 1
1 -
2
-
3
-
4
-
5
-
6
-
7
-
8
-
9
-
10
-
11
-
12
-
13
-
14
-
15
-
16
-
17
-
18
-
19
-
20
-
21
-
22
-
23
-
24
-
25
-
26
-
27
-
28
-
29
-
30
-
31
-
32
-
33
-
34
-
35
-
36
-
37
-
38
-
39
-
40
-
41
-
42
-
43
-
44
-
 45
45 -
 46
46 -
 47
47 -
 48
48 -
 49
49 -
 50
50 -
 51
51 -
 52
52 -
 53
53 -
 54
54 -
 55
55 -
 56
56 -
 57
57 -
 58
58 -
 59
59 -
 60
60 -
 61
61 -
 62
62 -
 63
63 -
 64
64 -
 65
65 -
66
-
67
-
68
-
69
-
70
-
71
-
72
-
73
-
74
-
75
-
76
-
77
-
78
-
79
-
80
-
81
-
82
-
83
-
84
-
85
-
86
-
87
-
88
-
89
-
90
-
91
-
92
-
93
-
94
-
95
-
96
-
97
-
98
-
99
-
100
-
101
-
102
-
103
-
104
-
105
-
106
-
107
-
108
-
109
-
110
-
111
-
112
-
113
-
114
-
115
-
116
-
117
-
118
-
119
-
120
-
121
-
122
-
123
-
124
-
125
-
126
-
127
-
128
-
129
-
130
-
131
-
132
-
133
-
134
-
135
-
136
-
137
-
138
-
139
-
140
-
141
-
142
-
143
-
144
-
145
-
146
-
147
-
148
-
149
-
150
-
151
-
152
-
153
-
154
-
155
-
156
-
157
-
158
-
159
-
160
-
161
-
162
-
163
-
164
-
165
-
166
-
167
-
168
-
169
-
170
-
171
-
172
-
173
-
174
-
175
-
176
-
177
-
178
-
179
-
180
-
181
-
182
-
183
-
184
-
185
-
186
-
187
-
188
-
189
-
190
-
191
-
192
-
193
-
194
-
195
-
196
-
197
-
198
-
199
-
200
-
201
-
202
-
203
-
204
-
205
-
206
-
207
-
208
-
209
-
210
-
211
-
212
-
213
-
214
-
215
-
216
-
217
-
218
-
219
-
220
-
221
 |
 |

Table of Contents
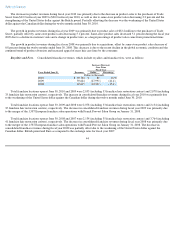
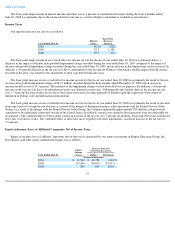
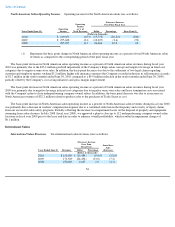
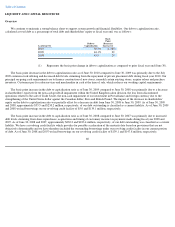
Equity in income of affiliated companies, net of taxes for the year ended June 30, 2010 was due to equity in income of $4.1, $6.4 and
$0.9 million recorded for our investments in Provalliance, EEG and Hair Club for Men, Ltd., respectively.
The increase in losses of affiliated companies, net of taxes for the year ended June 30, 2009 was primarily due to the impairment losses of
$25.7 and $4.8 million, on our investment in Provalliance and investment in and loans to Intelligent Nutrients, LLC, respectively. Primarily the
result of the weakened economy across continental Europe, Provalliance had recorded income at levels much less than expected by Regis
management during the Company's fiscal year ended June 30, 2009. In addition, Provalliance significantly increased its debt levels resulting
from acquisitions since January 31, 2008 but had significantly reduced future income expectations as a result of current economic conditions.
The Company calculated the estimated fair value of Provalliance based on discounted future cash flows that utilize estimates in annual revenue
growth, gross margins, capital expenditures, income taxes and long-term growth for determining terminal value. The discounted cash flow
model utilizes projected financial results based on Provalliance's business plans and historical trends. The increased debt and reduced earnings
expectations reduced the fair value of Provalliance as of June 30, 2009. Accordingly, the Company could no longer justify the carrying amount
of its investment in Provalliance and recorded a $25.7 million "other-than-temporary" impairment charge in its fourth quarter ended June 30,
2009. The $4.8 million impairment charge was based on Intelligent Nutrients, LLC's inability to develop a professional organic brand of
shampoo and conditioner with broad consumer appeal. The Company determined the losses in value to be "other-than-temporary." Partially
offsetting the impairment losses was equity in income recorded for our investments in Provalliance, EEG and Hair Club for Men, Ltd. See
Note 6 to the Consolidated Financial Statements for further discussion of each respective affiliated company.
Equity in income of affiliated companies, net of taxes for the year ended June 30, 2008 was due to equity in income recorded for our
investments in Provalliance and EEG, partially offset by equity in losses recorded for our investments in Intelligent Nutrients, LLC and
PureBeauty and BeautyFirst.
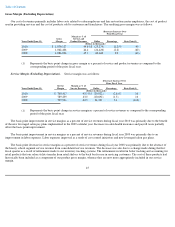
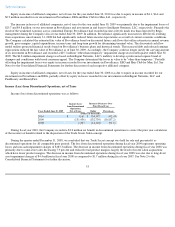
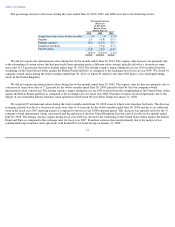
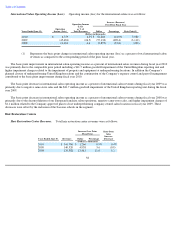
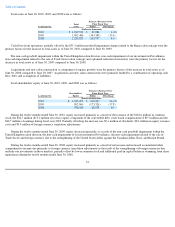
Income (Loss) from Discontinued Operations, net of Taxes
Income (loss) from discontinued operations was as follows:
During fiscal year 2010, the Company recorded a $3.0 million tax benefit in discontinued operations to correct the prior year calculation
of the income tax benefit related to the disposition of the Trade Secret Salon concept.
During the quarter ended December 31, 2008, we concluded that our Trade Secret concept was held for sale and presented it as
discontinued operations for all comparable prior periods. The loss from discontinued operations during fiscal year 2009 represents operating
losses and non-cash impairment charges of $183.3 million. The decrease in income from discontinued operations during fiscal year 2008 was
primarily due to same-store sales decreasing 7.9 percent and reduced retail product margins, largely the result of recent salon acquisitions
which have lower product margins. The decrease in income from discontinued operations during fiscal year 2008 was also due to long-lived
asset impairment charges of $4.4 million in fiscal year 2008 as compared to $1.7 million during fiscal year 2007. See Note 2 to the
Consolidated Financial Statements for further discussion.
53
Increase (Decrease) Over
Prior Fiscal Year
Income (Loss)
from Discontinued
Operations,
Net of Taxes
Years Ended June 30, 2009 Dollar Percentage
(Dollars in thousands)
2010
$
3,161
$
134,597
102.4
%
2009
(131,436
)
(132,739
)
(10,187.2
)
2008
1,303
(14,128
)
(91.6
)