Supercuts 2010 Annual Report Download - page 178
Download and view the complete annual report
Please find page 178 of the 2010 Supercuts annual report below. You can navigate through the pages in the report by either clicking on the pages listed below, or by using the keyword search tool below to find specific information within the annual report.-
 1
1 -
2
-
3
-
4
-
5
-
6
-
7
-
8
-
9
-
10
-
11
-
12
-
13
-
14
-
15
-
16
-
17
-
18
-
19
-
20
-
21
-
22
-
23
-
24
-
25
-
26
-
27
-
28
-
29
-
30
-
31
-
32
-
33
-
34
-
35
-
36
-
37
-
38
-
39
-
40
-
41
-
42
-
43
-
44
-
45
-
46
-
47
-
48
-
49
-
50
-
51
-
52
-
53
-
54
-
55
-
56
-
57
-
58
-
59
-
60
-
61
-
62
-
63
-
64
-
65
-
66
-
67
-
68
-
69
-
70
-
71
-
72
-
73
-
74
-
75
-
76
-
77
-
78
-
79
-
80
-
81
-
82
-
83
-
84
-
85
-
86
-
87
-
88
-
89
-
90
-
91
-
92
-
93
-
94
-
95
-
96
-
97
-
98
-
99
-
100
-
101
-
102
-
103
-
104
-
105
-
106
-
107
-
108
-
109
-
110
-
111
-
112
-
113
-
114
-
115
-
116
-
117
-
118
-
119
-
120
-
121
-
122
-
123
-
124
-
125
-
126
-
127
-
128
-
129
-
130
-
131
-
132
-
133
-
134
-
135
-
136
-
137
-
138
-
139
-
140
-
141
-
142
-
143
-
144
-
145
-
146
-
147
-
148
-
149
-
150
-
151
-
152
-
153
-
154
-
155
-
156
-
157
-
158
-
159
-
160
-
161
-
162
-
163
-
164
-
165
-
166
-
167
-
 168
168 -
 169
169 -
 170
170 -
 171
171 -
 172
172 -
 173
173 -
 174
174 -
 175
175 -
 176
176 -
 177
177 -
 178
178 -
 179
179 -
 180
180 -
 181
181 -
 182
182 -
 183
183 -
 184
184 -
 185
185 -
 186
186 -
 187
187 -
 188
188 -
189
-
190
-
191
-
192
-
193
-
194
-
195
-
196
-
197
-
198
-
199
-
200
-
201
-
202
-
203
-
204
-
205
-
206
-
207
-
208
-
209
-
210
-
211
-
212
-
213
-
214
-
215
-
216
-
217
-
218
-
219
-
220
-
221
 |
 |

PROVALLIANCE SAS
CONSOLIDATED FINANCIAL STATEMETS
DECEMBER 31, 2009 AND 2008
NOTES TO THE CONSOLIDATED FINANCIAL STATEMENTS (Continued)
(INFORMATION AS OF DECEMBER 31, 2009 AND FOR THE YEAR THEN ENDED NOT
COVERED BY AUDITORS' REPORT INCLUDED HEREIN)
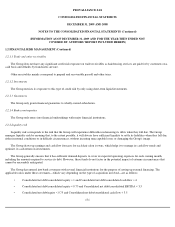
1.2 FINANCIAL RISK MANAGEMENT (Continued)
1.2.1.1 Trade and other receivables
The Group does not have any significant credit risk exposure on trade receivables as hairdressing services are paid for by customers on a
cash basis and defaults by franchisees are rare.
Other receivables mainly correspond to prepaid and recoverable payroll and other taxes.
1.2.1.2 Investments
The Group restricts its exposure to this type of credit risk by only using short-term liquid investments.
1.2.1.3 Guarantees
The Group only grants financial guarantees to wholly-owned subsidiaries.
1.2.1.4 Bank counterparties
The Group only enters into financial undertakings with major financial institutions.
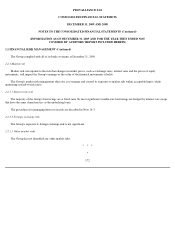
1.2.2 Liquidity risk
Liquidity risk corresponds to the risk that the Group will experience difficulties in honoring its debts when they fall due. The Group
manages liquidity risk by ensuring that, to the extent possible, it will always have sufficient liquidity to settle its liabilities when they fall due,
either in normal conditions or in difficult circumstances, without incurring unacceptable losses or damaging the Group's image.
The Group draws up earnings and cash flow forecasts for each hair salon it owns, which helps it to manage its cash flow needs and
optimize its cash return on investments.
The Group generally ensures that it has sufficient demand deposits to cover its expected operating expenses for each coming month,
including the amounts required to service its debt. However, these funds do not factor in the potential impact of extreme circumstances that
cannot be reasonably anticipated.
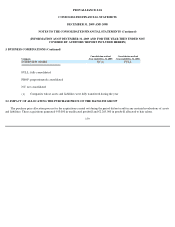
The Group has entered into bank covenants with several financial institutions for the purpose of setting up external financing. The
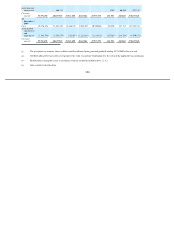
applicable ratios under these covenants—which vary depending on the type of acquisition involved—are as follows:
• Consolidated net debt/consolidated equity < 1 and Consolidated net debt/consolidated cash flow < 4
• Consolidated net debt/consolidated equity < 0.75 and Consolidated net debt/consolidated EBITDA < 3.5
• Consolidated net debt/equity < 0.75 and Consolidated net debt/consolidated cash flow < 3.5
171