Supercuts 2010 Annual Report Download - page 133
Download and view the complete annual report
Please find page 133 of the 2010 Supercuts annual report below. You can navigate through the pages in the report by either clicking on the pages listed below, or by using the keyword search tool below to find specific information within the annual report.-
 1
1 -
2
-
3
-
4
-
5
-
6
-
7
-
8
-
9
-
10
-
11
-
12
-
13
-
14
-
15
-
16
-
17
-
18
-
19
-
20
-
21
-
22
-
23
-
24
-
25
-
26
-
27
-
28
-
29
-
30
-
31
-
32
-
33
-
34
-
35
-
36
-
37
-
38
-
39
-
40
-
41
-
42
-
43
-
44
-
45
-
46
-
47
-
48
-
49
-
50
-
51
-
52
-
53
-
54
-
55
-
56
-
57
-
58
-
59
-
60
-
61
-
62
-
63
-
64
-
65
-
66
-
67
-
68
-
69
-
70
-
71
-
72
-
73
-
74
-
75
-
76
-
77
-
78
-
79
-
80
-
81
-
82
-
83
-
84
-
85
-
86
-
87
-
88
-
89
-
90
-
91
-
92
-
93
-
94
-
95
-
96
-
97
-
98
-
99
-
100
-
101
-
102
-
103
-
104
-
105
-
106
-
107
-
108
-
109
-
110
-
111
-
112
-
113
-
114
-
115
-
116
-
117
-
118
-
119
-
120
-
121
-
122
-
 123
123 -
 124
124 -
 125
125 -
 126
126 -
 127
127 -
 128
128 -
 129
129 -
 130
130 -
 131
131 -
 132
132 -
 133
133 -
 134
134 -
 135
135 -
 136
136 -
 137
137 -
 138
138 -
 139
139 -
 140
140 -
 141
141 -
 142
142 -
 143
143 -
144
-
145
-
146
-
147
-
148
-
149
-
150
-
151
-
152
-
153
-
154
-
155
-
156
-
157
-
158
-
159
-
160
-
161
-
162
-
163
-
164
-
165
-
166
-
167
-
168
-
169
-
170
-
171
-
172
-
173
-
174
-
175
-
176
-
177
-
178
-
179
-
180
-
181
-
182
-
183
-
184
-
185
-
186
-
187
-
188
-
189
-
190
-
191
-
192
-
193
-
194
-
195
-
196
-
197
-
198
-
199
-
200
-
201
-
202
-
203
-
204
-
205
-
206
-
207
-
208
-
209
-
210
-
211
-
212
-
213
-
214
-
215
-
216
-
217
-
218
-
219
-
220
-
221
 |
 |

Table of Contents
NOTES TO CONSOLIDATED FINANCIAL STATEMENTS (Continued)
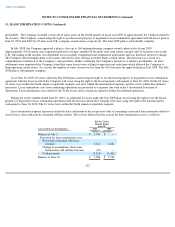
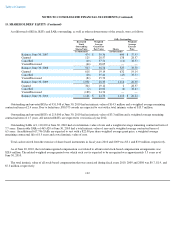
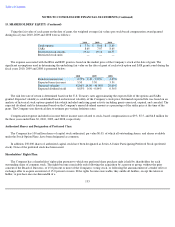
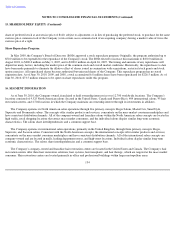
15. SHAREHOLDERS' EQUITY
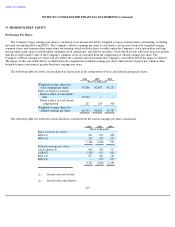
Net Income Per Share:
The Company's basic earnings per share is calculated as net income divided by weighted average common shares outstanding, excluding
unvested outstanding RSAs and RSUs. The Company's dilutive earnings per share is calculated as net income divided by weighted average
common shares and common share equivalents outstanding, which includes shares issuable under the Company's stock option plan and long-
term incentive plan, shares issuable under contingent stock agreements, and dilutive securities. Stock-based awards with exercise prices greater
than the average market value of the Company's common stock are excluded from the computation of diluted earnings per share. The
Company's dilutive earnings per share will also reflect the assumed conversion under the Company's convertible debt if the impact is dilutive.
The impact of the convertible debt is excluded from the computation of diluted earnings per share when interest expense per common share
obtainable upon conversion is greater than basic earnings per share.
The following table sets forth a reconciliation of shares used in the computation of basic and diluted earnings per share:
The following table sets forth the awards which are excluded from the various earnings per share calculations:
129
2010 2009 2008
(Shares in thousands)
Weighted average shares for
basic earnings per share
55,806
42,897
43,157
Effect of dilutive securities:
Dilutive effect of convertible
debt
10,730
—
—
Dilutive effect of stock-based
compensation
217
129
430
Weighted average shares for
diluted earnings per share
66,753
43,026
43,587
2010 2009 2008
(Shares in thousands)
Basic earnings per share:
RSAs(1)
931
817
308
RSUs(1)
215
215
215
1,146
1,032
523
Diluted earnings per share:
Stock options(2)
960
899
517
SARs(2)
1,110
613
416
RSAs(2)
677
301
183
RSUs(2)
—
215
215
2,747
2,028
1,331
(1) Awards were not vested
(2)
Awards were anti-dilutive