Supercuts 2010 Annual Report Download - page 193
Download and view the complete annual report
Please find page 193 of the 2010 Supercuts annual report below. You can navigate through the pages in the report by either clicking on the pages listed below, or by using the keyword search tool below to find specific information within the annual report.-
 1
1 -
2
-
3
-
4
-
5
-
6
-
7
-
8
-
9
-
10
-
11
-
12
-
13
-
14
-
15
-
16
-
17
-
18
-
19
-
20
-
21
-
22
-
23
-
24
-
25
-
26
-
27
-
28
-
29
-
30
-
31
-
32
-
33
-
34
-
35
-
36
-
37
-
38
-
39
-
40
-
41
-
42
-
43
-
44
-
45
-
46
-
47
-
48
-
49
-
50
-
51
-
52
-
53
-
54
-
55
-
56
-
57
-
58
-
59
-
60
-
61
-
62
-
63
-
64
-
65
-
66
-
67
-
68
-
69
-
70
-
71
-
72
-
73
-
74
-
75
-
76
-
77
-
78
-
79
-
80
-
81
-
82
-
83
-
84
-
85
-
86
-
87
-
88
-
89
-
90
-
91
-
92
-
93
-
94
-
95
-
96
-
97
-
98
-
99
-
100
-
101
-
102
-
103
-
104
-
105
-
106
-
107
-
108
-
109
-
110
-
111
-
112
-
113
-
114
-
115
-
116
-
117
-
118
-
119
-
120
-
121
-
122
-
123
-
124
-
125
-
126
-
127
-
128
-
129
-
130
-
131
-
132
-
133
-
134
-
135
-
136
-
137
-
138
-
139
-
140
-
141
-
142
-
143
-
144
-
145
-
146
-
147
-
148
-
149
-
150
-
151
-
152
-
153
-
154
-
155
-
156
-
157
-
158
-
159
-
160
-
161
-
162
-
163
-
164
-
165
-
166
-
167
-
168
-
169
-
170
-
171
-
172
-
173
-
174
-
175
-
176
-
177
-
178
-
179
-
180
-
181
-
182
-
 183
183 -
 184
184 -
 185
185 -
 186
186 -
 187
187 -
 188
188 -
 189
189 -
 190
190 -
 191
191 -
 192
192 -
 193
193 -
 194
194 -
 195
195 -
 196
196 -
 197
197 -
 198
198 -
 199
199 -
 200
200 -
 201
201 -
 202
202 -
 203
203 -
204
-
205
-
206
-
207
-
208
-
209
-
210
-
211
-
212
-
213
-
214
-
215
-
216
-
217
-
218
-
219
-
220
-
221
 |
 |

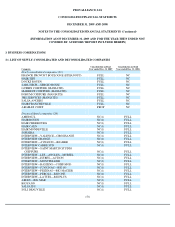
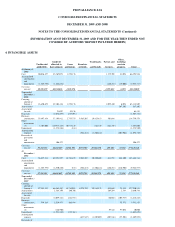
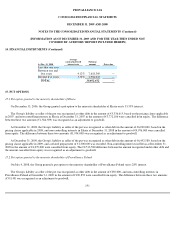
PROVALLIANCE SAS
CONSOLIDATED FINANCIAL STATEMETS
DECEMBER 31, 2009 AND 2008
NOTES TO THE CONSOLIDATED FINANCIAL STATEMENTS (Continued)
(INFORMATION AS OF DECEMBER 31, 2009 AND FOR THE YEAR THEN ENDED NOT
COVERED BY AUDITORS' REPORT INCLUDED HEREIN)
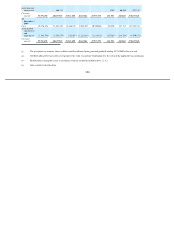
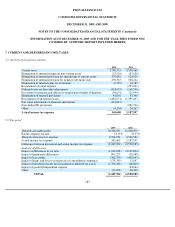
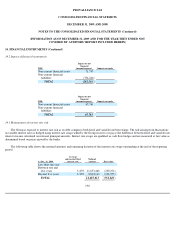
7. CURRENT AND DEFERRED INCOME TAXES
7.1. Analysis of income tax expense
7.2. Tax proof
183
2009 2008
Current taxes
1,700,521
3,538,460
Elimination of internal margin on non
-
current assets
(25,526
)
(87,638
)
Elimination of internal provision for impairment of current assets
370,042
120,529
Elimination of internal provision for negative net equity risk
290,325
106,244
Elimination of internal gains on inventories
(6,729
)
16,785
Restatement of rental expense
(295,201
)
Deferred taxes on fair value adjustments
(363,655
)
(169,796
)
Provisions for pension and other post
-
employment benefit obligations
(56,674
)
(25,994
)
Elimination of untaxed provisions
41,652
33,340
Recognition of unused tax losses
(1,482,071
)
(1,391,697
)
Fair value adjustments to financial instruments
(118,081
)
Non
-
deductible provisions
(681,702
)
Other
(4,204
)
24,267
Actual income tax expense
345,600
1,187,597
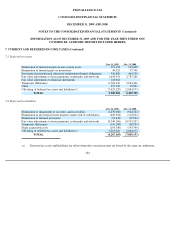
2009 2008
Theoretical taxable profit
10,786,055
11,240,870
Parent company tax rate
33.33
%
33.33
%
Theoretical income tax expense
3,594,992
3,746,582
Actual income tax expense
345,600
1,187,597
Difference between theoretical and actual income tax expense
(3,249,392
)
(2,558,985
)
Analysis of difference
Impact of differences in tax rates
(2,122,038
)
(2,139,806
)
Impact of permanent differences
803,223
(20,988
)
Impact of tax credits
(362,795
)
(408,993
)
Impact of gains and losses on disposals of consolidated companies
(178,740
)
15,847
Impact of unused tax losses not recognized as deferred tax assets
(1,376,349
)
(28,829
)
Impact of goodwill impairment expense
(24,664
)
Other
(12,693
)
48,448
TOTAL
(3,249,392
)
(2,558,985
)