Supercuts 2010 Annual Report Download - page 37
Download and view the complete annual report
Please find page 37 of the 2010 Supercuts annual report below. You can navigate through the pages in the report by either clicking on the pages listed below, or by using the keyword search tool below to find specific information within the annual report.-
 1
1 -
2
-
3
-
4
-
5
-
6
-
7
-
8
-
9
-
10
-
11
-
12
-
13
-
14
-
15
-
16
-
17
-
18
-
19
-
20
-
21
-
22
-
23
-
24
-
25
-
26
-
 27
27 -
 28
28 -
 29
29 -
 30
30 -
 31
31 -
 32
32 -
 33
33 -
 34
34 -
 35
35 -
 36
36 -
 37
37 -
 38
38 -
 39
39 -
 40
40 -
 41
41 -
 42
42 -
 43
43 -
 44
44 -
 45
45 -
 46
46 -
 47
47 -
48
-
49
-
50
-
51
-
52
-
53
-
54
-
55
-
56
-
57
-
58
-
59
-
60
-
61
-
62
-
63
-
64
-
65
-
66
-
67
-
68
-
69
-
70
-
71
-
72
-
73
-
74
-
75
-
76
-
77
-
78
-
79
-
80
-
81
-
82
-
83
-
84
-
85
-
86
-
87
-
88
-
89
-
90
-
91
-
92
-
93
-
94
-
95
-
96
-
97
-
98
-
99
-
100
-
101
-
102
-
103
-
104
-
105
-
106
-
107
-
108
-
109
-
110
-
111
-
112
-
113
-
114
-
115
-
116
-
117
-
118
-
119
-
120
-
121
-
122
-
123
-
124
-
125
-
126
-
127
-
128
-
129
-
130
-
131
-
132
-
133
-
134
-
135
-
136
-
137
-
138
-
139
-
140
-
141
-
142
-
143
-
144
-
145
-
146
-
147
-
148
-
149
-
150
-
151
-
152
-
153
-
154
-
155
-
156
-
157
-
158
-
159
-
160
-
161
-
162
-
163
-
164
-
165
-
166
-
167
-
168
-
169
-
170
-
171
-
172
-
173
-
174
-
175
-
176
-
177
-
178
-
179
-
180
-
181
-
182
-
183
-
184
-
185
-
186
-
187
-
188
-
189
-
190
-
191
-
192
-
193
-
194
-
195
-
196
-
197
-
198
-
199
-
200
-
201
-
202
-
203
-
204
-
205
-
206
-
207
-
208
-
209
-
210
-
211
-
212
-
213
-
214
-
215
-
216
-
217
-
218
-
219
-
220
-
221
 |
 |

Table of Contents
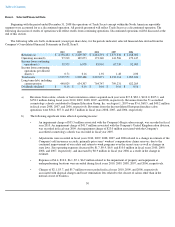
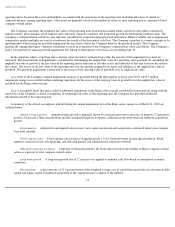
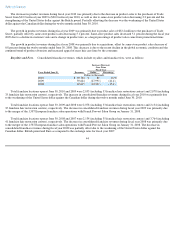
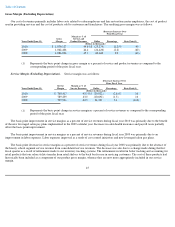
The following table summarizes the approximate impact that a change in certain critical assumptions would have on the estimated fair
value of our Regis salon concept reporting unit (the approximate impact of the change in the critical assumptions assumes all other assumptions
and factors remain constant, in thousands, except percentages):
As of March 31, 2010, the estimated fair value of the Promenade salon concept exceeded its respective carrying value by approximately
10 percent. As it is reasonably likely that there could be impairment of the Promenade salon concept's goodwill in future periods along with the
sensitivity of the Company's critical assumptions in estimating fair value of this reporting unit, the Company has provided additional
information related to this reporting unit.
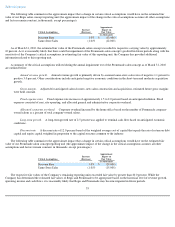
A summary of the critical assumptions utilized during the annual impairment test of the Promenade salon concept as of March 31, 2010
are outlined below:
Annual revenue growth. Annual revenue growth is primarily driven by assumed same-
store sales rates of negative 1.1 percent to
positive 3.0 percent. Other considerations include anticipated negative economic conditions in the short-term and moderate acquisition
growth.
Gross margin. Adjusted for anticipated salon closures, new salon construction and acquisitions, estimated future gross margins
were held constant.
Fixed expense rates. Fixed expense rate increases of approximately 1.5 to 2.0 percent based on anticipated inflation. Fixed
expenses consisted of rent, site operating, and allocated general and administrative corporate overhead.
Allocated corporate overhead. Corporate overhead incurred by the home office based on the number of Promenade company-
owned salons as a percent of total company-owned salons.
Long-term growth. A long-term growth rate of 2.5 percent was applied to terminal cash flow based on anticipated economic
conditions.
Discount rate.
A discount rate of 12.0 percent based of the weighted average cost of capital that equals the rate of return on debt
capital and equity capital weighted in proportion to the capital structure common to the industry.
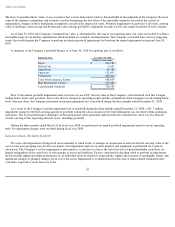
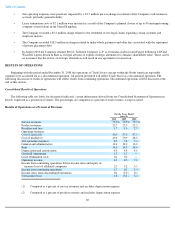
The following table summarizes the approximate impact that a change in certain critical assumptions would have on the estimated fair
value of our Promenade salon concept reporting unit (the approximate impact of the change in the critical assumptions assumes all other
assumptions and factors remain constant, in thousands, except percentages):
The respective fair values of the Company's remaining reporting units exceeded fair value by greater than 20.0 percent. While the
Company has determined the estimated fair values of Regis and Promenade to be appropriate based on the historical level of revenue growth,
operating income and cash flows, it is reasonably likely that Regis and Promenade may become impaired in future periods.
35
Critical Assumptions Increase
(Decrease)
Approximate
Impact on
Fair Value
(in thousands)
Discount Rate
1.0
%
$
(13,000
)
Same
-
Store Sales
(1.0
)%
(12,000
)
Critical Assumptions Increase
(Decrease)
Approximate
Impact on
Fair Value
(in thousands)
Discount Rate
1.0
%
$
(29,000
)
Same
-
Store Sales
(1.0
)%
(15,000
)