Supercuts 2010 Annual Report Download - page 46
Download and view the complete annual report
Please find page 46 of the 2010 Supercuts annual report below. You can navigate through the pages in the report by either clicking on the pages listed below, or by using the keyword search tool below to find specific information within the annual report.-
 1
1 -
2
-
3
-
4
-
5
-
6
-
7
-
8
-
9
-
10
-
11
-
12
-
13
-
14
-
15
-
16
-
17
-
18
-
19
-
20
-
21
-
22
-
23
-
24
-
25
-
26
-
27
-
28
-
29
-
30
-
31
-
32
-
33
-
34
-
35
-
 36
36 -
 37
37 -
 38
38 -
 39
39 -
 40
40 -
 41
41 -
 42
42 -
 43
43 -
 44
44 -
 45
45 -
 46
46 -
 47
47 -
 48
48 -
 49
49 -
 50
50 -
 51
51 -
 52
52 -
 53
53 -
 54
54 -
 55
55 -
 56
56 -
57
-
58
-
59
-
60
-
61
-
62
-
63
-
64
-
65
-
66
-
67
-
68
-
69
-
70
-
71
-
72
-
73
-
74
-
75
-
76
-
77
-
78
-
79
-
80
-
81
-
82
-
83
-
84
-
85
-
86
-
87
-
88
-
89
-
90
-
91
-
92
-
93
-
94
-
95
-
96
-
97
-
98
-
99
-
100
-
101
-
102
-
103
-
104
-
105
-
106
-
107
-
108
-
109
-
110
-
111
-
112
-
113
-
114
-
115
-
116
-
117
-
118
-
119
-
120
-
121
-
122
-
123
-
124
-
125
-
126
-
127
-
128
-
129
-
130
-
131
-
132
-
133
-
134
-
135
-
136
-
137
-
138
-
139
-
140
-
141
-
142
-
143
-
144
-
145
-
146
-
147
-
148
-
149
-
150
-
151
-
152
-
153
-
154
-
155
-
156
-
157
-
158
-
159
-
160
-
161
-
162
-
163
-
164
-
165
-
166
-
167
-
168
-
169
-
170
-
171
-
172
-
173
-
174
-
175
-
176
-
177
-
178
-
179
-
180
-
181
-
182
-
183
-
184
-
185
-
186
-
187
-
188
-
189
-
190
-
191
-
192
-
193
-
194
-
195
-
196
-
197
-
198
-
199
-
200
-
201
-
202
-
203
-
204
-
205
-
206
-
207
-
208
-
209
-
210
-
211
-
212
-
213
-
214
-
215
-
216
-
217
-
218
-
219
-
220
-
221
 |
 |

Table of Contents
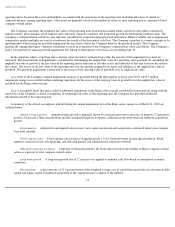
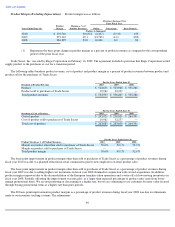
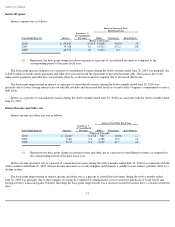
The decrease in product revenues during fiscal year 2010 was primarily due to the decrease in product sales to the purchaser of Trade
Secret from $32.2 in fiscal year 2009 to $20.0 in fiscal year 2010, as well as due to same-store product sales decreasing 2.3 percent and the
strengthening of the United States dollar against the British pound. Partially offsetting the decrease was the weakening of the United States
dollar against the Canadian dollar during the twelve months ended June 30, 2010.
The growth in product revenues during fiscal year 2009 was primarily due to product sales of $32.2 million to the purchaser of Trade
Secret, partially offset by same-store product sales decreasing 5.1 percent. Same-
store product sales decreased 5.1 percent during the fiscal year
2009 due to a decline in customer visits and a change in product mix, as a larger percentage of product sales came from promotional items.
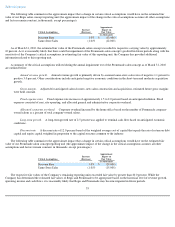
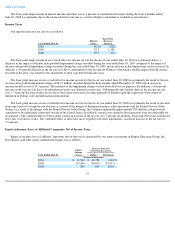
The growth in product revenues during fiscal year 2008 was primarily due to acquisitions, offset by same-store product sales decrease of
0.8 percent during the twelve months ended June 30, 2008. This decrease is due to the recent decline in the global economic condition and the
continued trend of product diversion and increased appeal of mass hair care lines by the consumer.
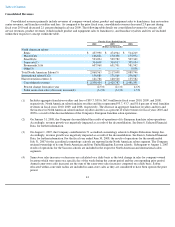
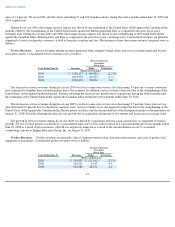
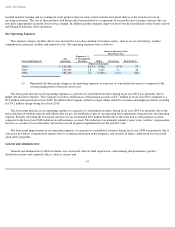
Royalties and Fees. Consolidated franchise revenues, which include royalties and franchise fees, were as follows:
Total franchise locations open at June 30, 2010 and 2009 were 2,053 (including 33 franchise hair restoration centers) and 2,078 (including
33 franchise hair restoration centers), respectively. The increase in consolidated franchise revenues during fiscal year 2010 was primarily due
to the weakening of the United States dollar against the Canadian dollar during the twelve months ended June 30, 2010.
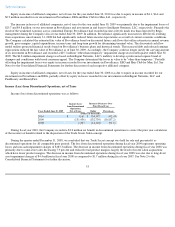
Total franchise locations open at June 30, 2009 and 2008 were 2,078 (including 33 franchise hair restoration centers) and 2,134 (including
35 franchise hair restoration centers), respectively. The decrease in consolidated franchise revenues during fiscal year 2009 was primarily due
to the merger of the 1,587 European franchise salon operations with Franck Provost Salon Group on January 31, 2008.
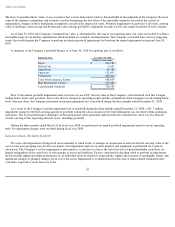
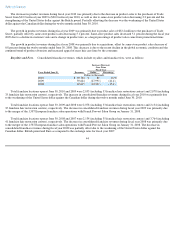
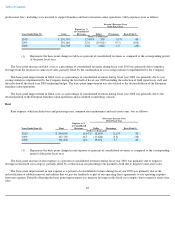
Total franchise locations open at June 30, 2008 and 2007 were 2,134 (including 35 franchise hair restoration centers) and 3,764 (including
41 franchise hair restoration centers), respectively. The decrease in consolidated franchise revenues during fiscal year 2008 was primarily due
to the merger of the 1,587 European franchise salon operations with Franck Provost Salon Group on January 31, 2008. The decrease in
consolidated franchise revenues during fiscal year 2008 was partially offset due to the weakening of the United States dollar against the
Canadian dollar, British pound and Euro as compared to the exchange rates for fiscal year 2007.
44
Increase (Decrease)
Over Prior
Fiscal Year
Years Ended June 30, Revenues Dollar Percentage
(Dollars in thousands)
2010
$
39,704
$
80
0.2
%
2009
39,624
(27,991
)
(41.4
)
2008
67,615
(12,331
)
(15.4
)