Supercuts 2010 Annual Report Download - page 136
Download and view the complete annual report
Please find page 136 of the 2010 Supercuts annual report below. You can navigate through the pages in the report by either clicking on the pages listed below, or by using the keyword search tool below to find specific information within the annual report.-
 1
1 -
2
-
3
-
4
-
5
-
6
-
7
-
8
-
9
-
10
-
11
-
12
-
13
-
14
-
15
-
16
-
17
-
18
-
19
-
20
-
21
-
22
-
23
-
24
-
25
-
26
-
27
-
28
-
29
-
30
-
31
-
32
-
33
-
34
-
35
-
36
-
37
-
38
-
39
-
40
-
41
-
42
-
43
-
44
-
45
-
46
-
47
-
48
-
49
-
50
-
51
-
52
-
53
-
54
-
55
-
56
-
57
-
58
-
59
-
60
-
61
-
62
-
63
-
64
-
65
-
66
-
67
-
68
-
69
-
70
-
71
-
72
-
73
-
74
-
75
-
76
-
77
-
78
-
79
-
80
-
81
-
82
-
83
-
84
-
85
-
86
-
87
-
88
-
89
-
90
-
91
-
92
-
93
-
94
-
95
-
96
-
97
-
98
-
99
-
100
-
101
-
102
-
103
-
104
-
105
-
106
-
107
-
108
-
109
-
110
-
111
-
112
-
113
-
114
-
115
-
116
-
117
-
118
-
119
-
120
-
121
-
122
-
123
-
124
-
125
-
 126
126 -
 127
127 -
 128
128 -
 129
129 -
 130
130 -
 131
131 -
 132
132 -
 133
133 -
 134
134 -
 135
135 -
 136
136 -
 137
137 -
 138
138 -
 139
139 -
 140
140 -
 141
141 -
 142
142 -
 143
143 -
 144
144 -
 145
145 -
 146
146 -
147
-
148
-
149
-
150
-
151
-
152
-
153
-
154
-
155
-
156
-
157
-
158
-
159
-
160
-
161
-
162
-
163
-
164
-
165
-
166
-
167
-
168
-
169
-
170
-
171
-
172
-
173
-
174
-
175
-
176
-
177
-
178
-
179
-
180
-
181
-
182
-
183
-
184
-
185
-
186
-
187
-
188
-
189
-
190
-
191
-
192
-
193
-
194
-
195
-
196
-
197
-
198
-
199
-
200
-
201
-
202
-
203
-
204
-
205
-
206
-
207
-
208
-
209
-
210
-
211
-
212
-
213
-
214
-
215
-
216
-
217
-
218
-
219
-
220
-
221
 |
 |

Table of Contents
NOTES TO CONSOLIDATED FINANCIAL STATEMENTS (Continued)
15. SHAREHOLDERS' EQUITY (Continued)
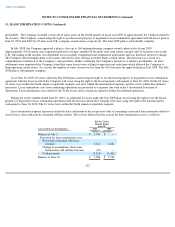
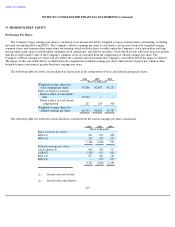
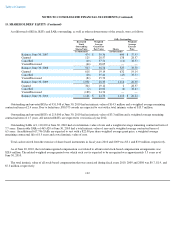
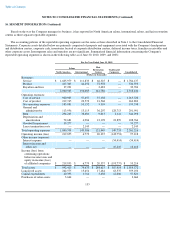
A rollforward of RSAs, RSUs and SARs outstanding, as well as other relevant terms of the awards, were as follows:
Outstanding and unvested RSAs of 931,348 at June 30, 2010 had an intrinsic value of $14.5 million and a weighted average remaining
contractual term of 2.4 years. Due to forfeitures, 880,373 awards are expected to vest with a total intrinsic value of $13.7 million.
Outstanding and unvested RSUs of 215,000 at June 30, 2010 had an intrinsic value of $3.3 million and a weighted average remaining
contractual term of 1.7 years. All unvested RSUs are expected to vest in fiscal year 2012.
Outstanding SARs of 1,110,100 at June 30, 2010 had a total intrinsic value of zero and a weighted average remaining contractual term of
7.7 years. Exercisable SARs of 465,420 at June 30, 2010 had a total intrinsic value of zero and a weighted average contractual term of
6.5 years. An additional 617,796 SARs are expected to vest with a $22.00 per share weighted average grant price, a weighted average
remaining contractual life of 8.5 years and a total intrinsic value of zero.
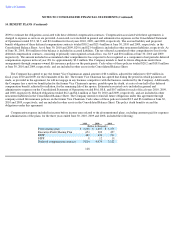
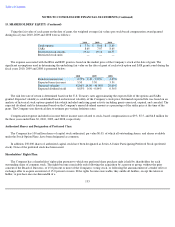
Total cash received from the exercise of share-based instruments in fiscal years 2010 and 2009 was $3.1 and $3.9 million, respectively.
As of June 30, 2010, the total unrecognized compensation cost related to all unvested stock-based compensation arrangements was
$28.4 million. The related weighted average period over which such cost is expected to be recognized was approximately 3.5 years as of
June 30, 2010.
The total intrinsic value of all stock-based compensation that was exercised during fiscal years 2010, 2009 and 2008 was $0.7, $1.9, and
$7.3 million, respectively.
132
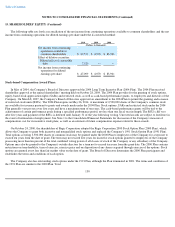
Nonvested SARs Outstanding
Restricted
Stock
Outstanding
Shares/Units
Weighted
Average
Grant Date
Fair Value Shares
Weighted
Average
Exercise
Price
(in thousands)
(in thousands)
Balance, June 30, 2007
474
$
38.36
400
$
37.53
Granted
125
28.57
138
28.57
Cancelled
(10
)
37.71
(11
)
38.53
Vested/Exercised
(66
)
38.05
—
—
Balance, June 30, 2008
523
36.76
527
35.70
Granted
618
19.14
632
19.14
Cancelled
(28
)
35.41
(45
)
35.73
Vested/Exercised
(81
)
35.72
—
—
Balance, June 30, 2009
1,032
26.33
1,114
26.30
Granted
304
19.12
2
28.57
Cancelled
(2
)
20.02
(6
)
38.63
Vested/Exercised
(188
)
24.74
—
—
Balance, June 30, 2010
1,146
$
24.70
1,110
$
26.24