Supercuts 2010 Annual Report Download - page 139
Download and view the complete annual report
Please find page 139 of the 2010 Supercuts annual report below. You can navigate through the pages in the report by either clicking on the pages listed below, or by using the keyword search tool below to find specific information within the annual report.-
 1
1 -
2
-
3
-
4
-
5
-
6
-
7
-
8
-
9
-
10
-
11
-
12
-
13
-
14
-
15
-
16
-
17
-
18
-
19
-
20
-
21
-
22
-
23
-
24
-
25
-
26
-
27
-
28
-
29
-
30
-
31
-
32
-
33
-
34
-
35
-
36
-
37
-
38
-
39
-
40
-
41
-
42
-
43
-
44
-
45
-
46
-
47
-
48
-
49
-
50
-
51
-
52
-
53
-
54
-
55
-
56
-
57
-
58
-
59
-
60
-
61
-
62
-
63
-
64
-
65
-
66
-
67
-
68
-
69
-
70
-
71
-
72
-
73
-
74
-
75
-
76
-
77
-
78
-
79
-
80
-
81
-
82
-
83
-
84
-
85
-
86
-
87
-
88
-
89
-
90
-
91
-
92
-
93
-
94
-
95
-
96
-
97
-
98
-
99
-
100
-
101
-
102
-
103
-
104
-
105
-
106
-
107
-
108
-
109
-
110
-
111
-
112
-
113
-
114
-
115
-
116
-
117
-
118
-
119
-
120
-
121
-
122
-
123
-
124
-
125
-
126
-
127
-
128
-
 129
129 -
 130
130 -
 131
131 -
 132
132 -
 133
133 -
 134
134 -
 135
135 -
 136
136 -
 137
137 -
 138
138 -
 139
139 -
 140
140 -
 141
141 -
 142
142 -
 143
143 -
 144
144 -
 145
145 -
 146
146 -
 147
147 -
 148
148 -
 149
149 -
150
-
151
-
152
-
153
-
154
-
155
-
156
-
157
-
158
-
159
-
160
-
161
-
162
-
163
-
164
-
165
-
166
-
167
-
168
-
169
-
170
-
171
-
172
-
173
-
174
-
175
-
176
-
177
-
178
-
179
-
180
-
181
-
182
-
183
-
184
-
185
-
186
-
187
-
188
-
189
-
190
-
191
-
192
-
193
-
194
-
195
-
196
-
197
-
198
-
199
-
200
-
201
-
202
-
203
-
204
-
205
-
206
-
207
-
208
-
209
-
210
-
211
-
212
-
213
-
214
-
215
-
216
-
217
-
218
-
219
-
220
-
221
 |
 |

Table of Contents
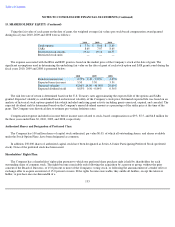
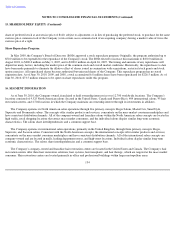
NOTES TO CONSOLIDATED FINANCIAL STATEMENTS (Continued)
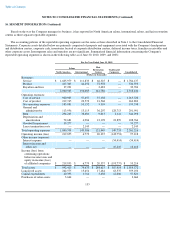
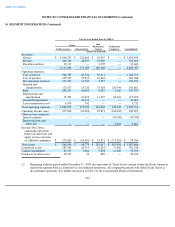
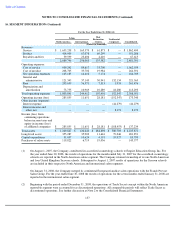
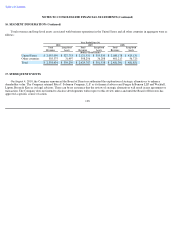
16. SEGMENT INFORMATION (Continued)
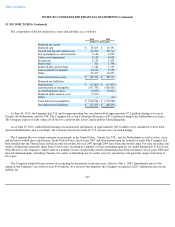
Based on the way the Company manages its business, it has reported its North American salons, international salons, and hair restoration
centers as three separate reportable segments.
The accounting policies of the reportable operating segments are the same as those described in Note 1 to the Consolidated Financial
Statements. Corporate assets detailed below are primarily comprised of property and equipment associated with the Company's headquarters
and distribution centers, corporate cash, inventories located at corporate distribution centers, deferred income taxes, franchise receivables and
other corporate assets. Intersegment sales and transfers are not significant. Summarized financial information concerning the Company's
reportable operating segments is shown in the following table as of June 30, 2010, 2009, and 2008:
135
For the Year Ended June 30, 2010
Salons
Hair
Restoration
Centers Unallocated
Corporate
North America International Consolidated
(Dollars in thousands)
Revenues:
Service
$
1,605,979
$
111,833
$
66,325
$
—
$
1,784,137
Product
417,363
44,252
72,978
—
534,593
Royalties and fees
37,221
—
2,483
—
39,704
2,060,563
156,085
141,786
—
2,358,434
Operating expenses:
Cost of service
920,905
57,657
37,158
—
1,015,720
Cost of product
219,745
22,570
21,568
—
263,883
Site operating expenses
183,881
10,152
5,305
—
199,338
General and
administrative
113,956
13,115
36,207
128,713
291,991
Rent
294,263
38,681
9,013
2,141
344,098
Depreciation and
amortization
72,681
4,986
12,198
18,899
108,764
Goodwill impairment
35,277
—
—
—
35,277
Lease termination costs
—
2,145
—
—
2,145
Total operating expenses
1,840,708
149,306
121,449
149,753
2,261,216
Operating income (loss)
219,855
6,779
20,337
(149,753
)
97,218
Other income (expense):
Interest expense
—
—
—
(
54,414
)
(54,414
)
Interest income and
other, net
—
—
—
10,410
10,410
Income (loss) from
continuing operations
before income taxes and
equity in income (loss)
of affiliated companies
$
219,855
$
6,779
$
20,337
$
(193,757
)
$
53,214
Total assets
$
992,410
$
74,633
$
284,615
$
567,914
$
1,919,572
Long
-
lived assets
262,575
15,654
17,484
63,537
359,250
Capital expenditures
40,393
1,764
3,658
12,006
57,821
Purchases of salon assets
3,664
—
—
—
3,664