Supercuts 2003 Annual Report Download - page 83
Download and view the complete annual report
Please find page 83 of the 2003 Supercuts annual report below. You can navigate through the pages in the report by either clicking on the pages listed below, or by using the keyword search tool below to find specific information within the annual report.-
 1
1 -
2
-
3
-
4
-
5
-
6
-
7
-
8
-
9
-
10
-
11
-
12
-
13
-
14
-
15
-
16
-
17
-
18
-
19
-
20
-
21
-
22
-
23
-
24
-
25
-
26
-
27
-
28
-
29
-
30
-
31
-
32
-
33
-
34
-
35
-
36
-
37
-
38
-
39
-
40
-
41
-
42
-
43
-
44
-
45
-
46
-
47
-
48
-
49
-
50
-
51
-
52
-
53
-
54
-
55
-
56
-
57
-
58
-
59
-
60
-
61
-
62
-
63
-
64
-
65
-
66
-
67
-
68
-
69
-
70
-
71
-
72
-
 73
73 -
 74
74 -
 75
75 -
 76
76 -
 77
77 -
 78
78 -
 79
79 -
 80
80 -
 81
81 -
 82
82 -
 83
83 -
 84
84 -
 85
85 -
 86
86 -
 87
87 -
 88
88 -
 89
89 -
 90
90 -
 91
91 -
 92
92 -
 93
93 -
94
-
95
-
96
-
97
-
98
-
99
-
100
-
101
-
102
-
103
-
104
-
105
-
106
-
107
-
108
-
109
-
110
-
111
-
112
-
113
-
114
-
115
-
116
-
117
-
118
-
119
-
120
-
121
 |
 |

Table of Contents
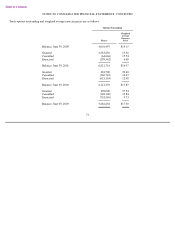
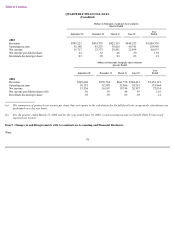
QUARTERLY FINANCIAL DATA
(Unaudited)
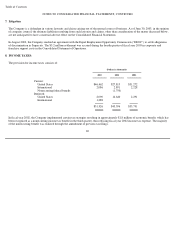
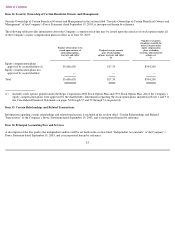
Item 9. Changes in and Disagreements with Accountants on Accounting and Financial Disclosure
None.
78
(Dollars in thousands, except per share amounts)
Quarter Ended
Year
September 30
December 31
March 31 June 30 Ended
2003
Revenues
$
399,223
$
414,759
$
422,315
$
448,233
$
1,684,530
Operating income
36,348
43,235
38,616
40,741
158,940
Net income
19,717
23,573
20,891
22,494
86,675
Net income per diluted share
.44
.52
.46
.50
1.92
Dividends declared per share
.03
.03
.03
.03
.12
(Dollars in thousands, except per share amounts)
Quarter Ended
Year
September 30 December 31
March 31
June 30 Ended
2002
Revenues
$
349,668
$
358,534
$
361,578
$
384,411
$
1,454,191
Operating income
30,152
32,585
32,866
38,261
133,864
Net income
15,356
16,967
19,334
20,397
72,054
Net income per diluted share(a)(b)
.36
.39
.44
.45
1.63
Dividends declared per share
.03
.03
.03
.03
.12
(a)
The summation of quarterly net income per share does not equate to the calculation for the full fiscal year as quarterly calculations are
performed on a discrete basis.
(b)
For the quarter ended March 31, 2002 and for the year ended June 30, 2002, a nonrecurring income tax benefit (Note 8) increased
reported net income.